Reporting
Corteza Reporter allows you to create beautiful reports using the data stored in your Low Code applications. This section focuses on the most important aspects of the system. If you wish to learn more about a specific topic, refer to the subsections under .
Create a new report
To create a report, navigate to your Corteza instance (for example http://latest.cortezaproject.org/) and click ok tne "Reporter" application.
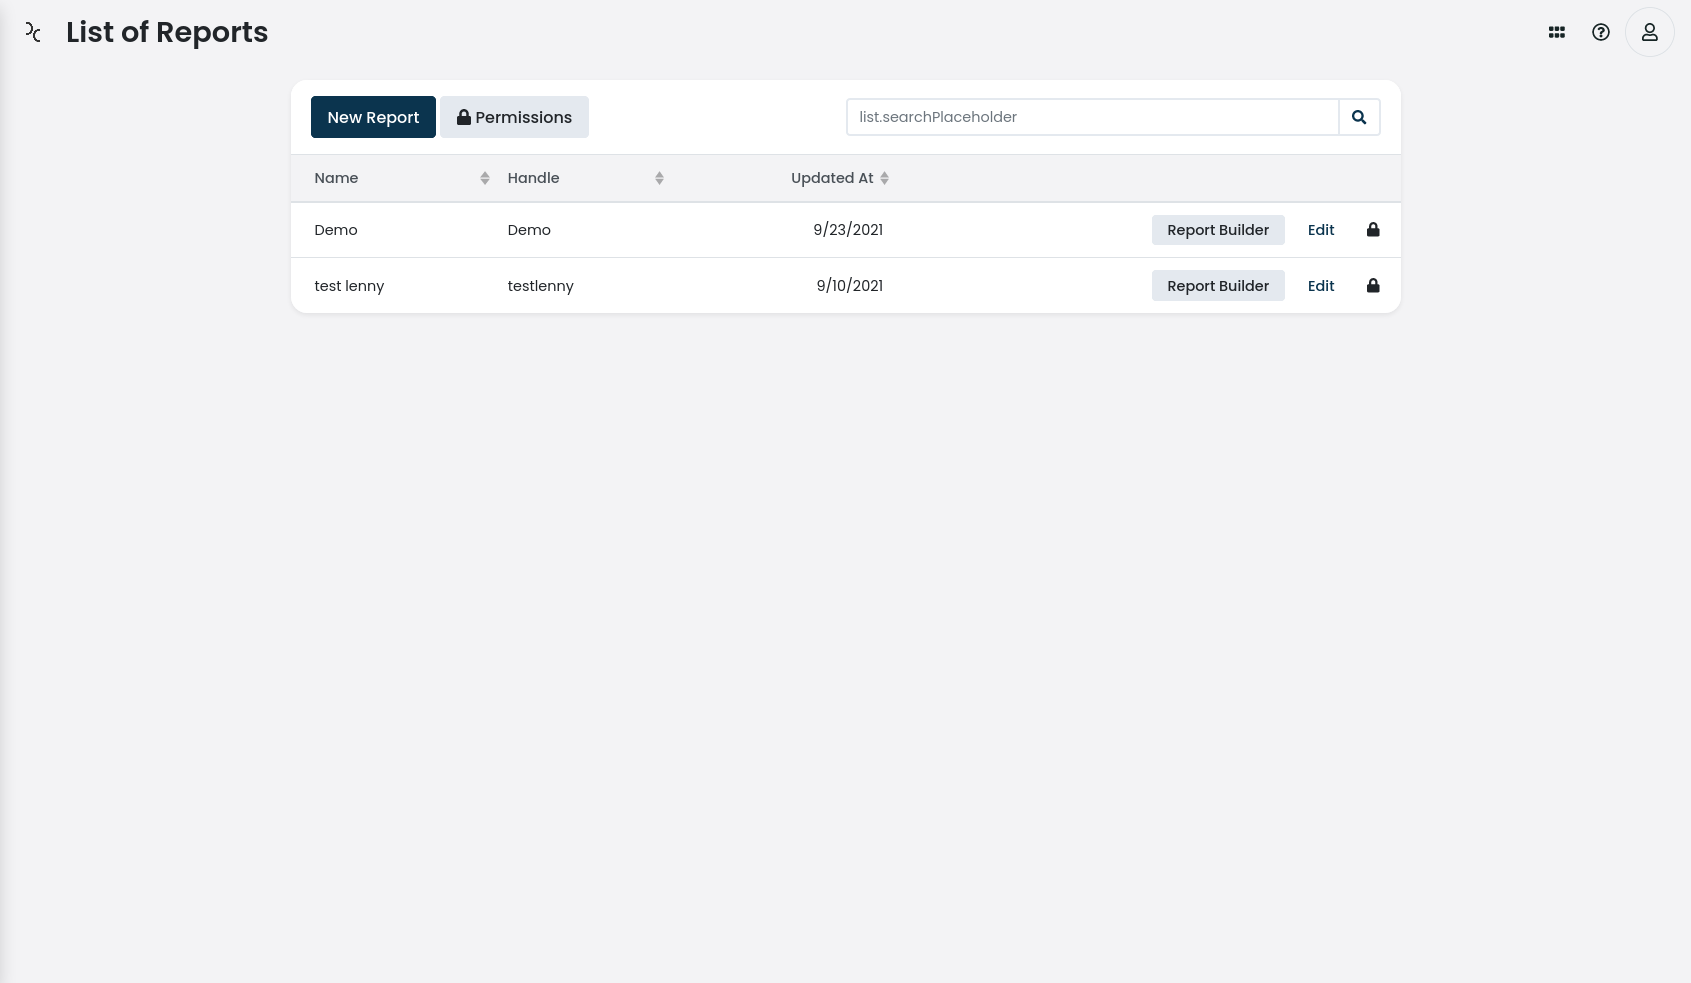
A new screen showing you all of the available reports will appear.
-
create new reports by clicking on the New Report button,
-
edit existing reports by clicking on the edit button,
-
open the report builder by clicking on the report builder button,
-
manage global permissions by clicking on the Permissions button, or
-
manage report-specific permissions by clicking on the "Lock" icon next to the report.
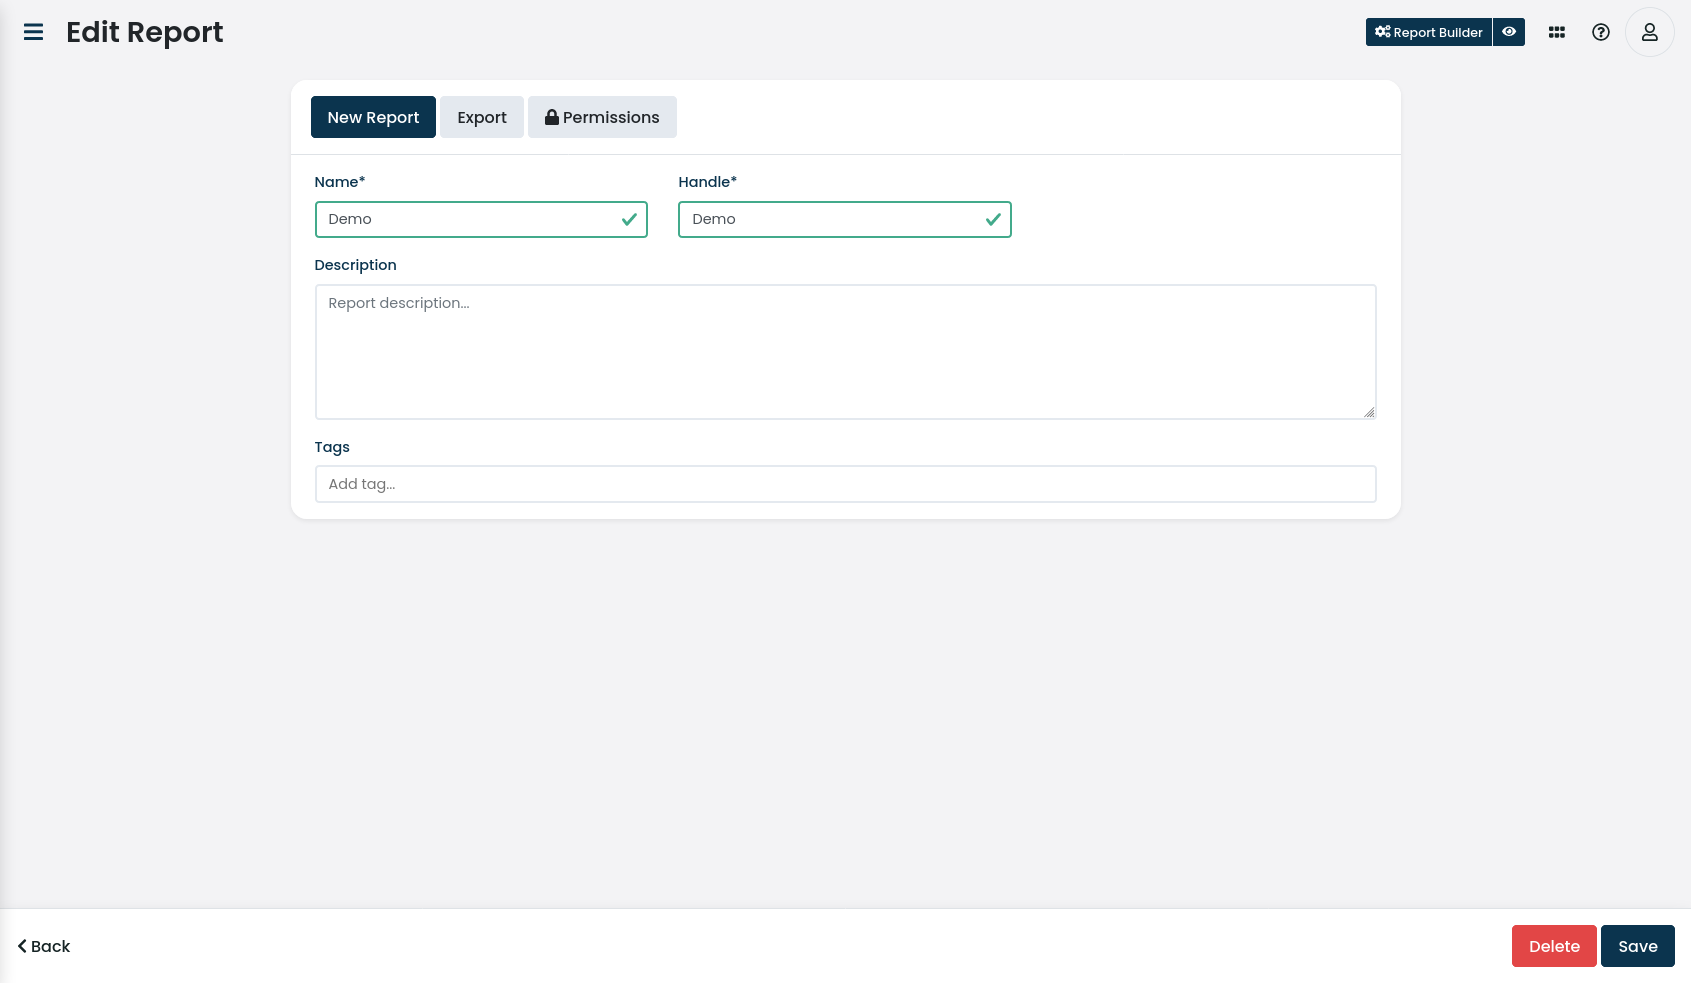
When you click on the New report button, a new screen will appear asking you to provide the base report parameters.
-
Name provides a human-friendly identifier for the report; for example "Test Report". A name doesn’t define any special constraints.
-
Handle defines a unique value that may be used instead of the system identifier for easier referencing.
-
Description defines a verbose description of the report to better explain what the report shows.
-
Tags define a series of short text snippets to describe your report.
-
start with a character,
-
contain at most 64 characters,
-
contain only characters, numbers, _ (underscore), - (dash) or . (dot),
-
end with a character or a number.
Report builder
The report builder is used to define the reports' structure using report blocks and a drag-and-drop interface. Each report has a grid of 12 columns and is not limited on the vertical.
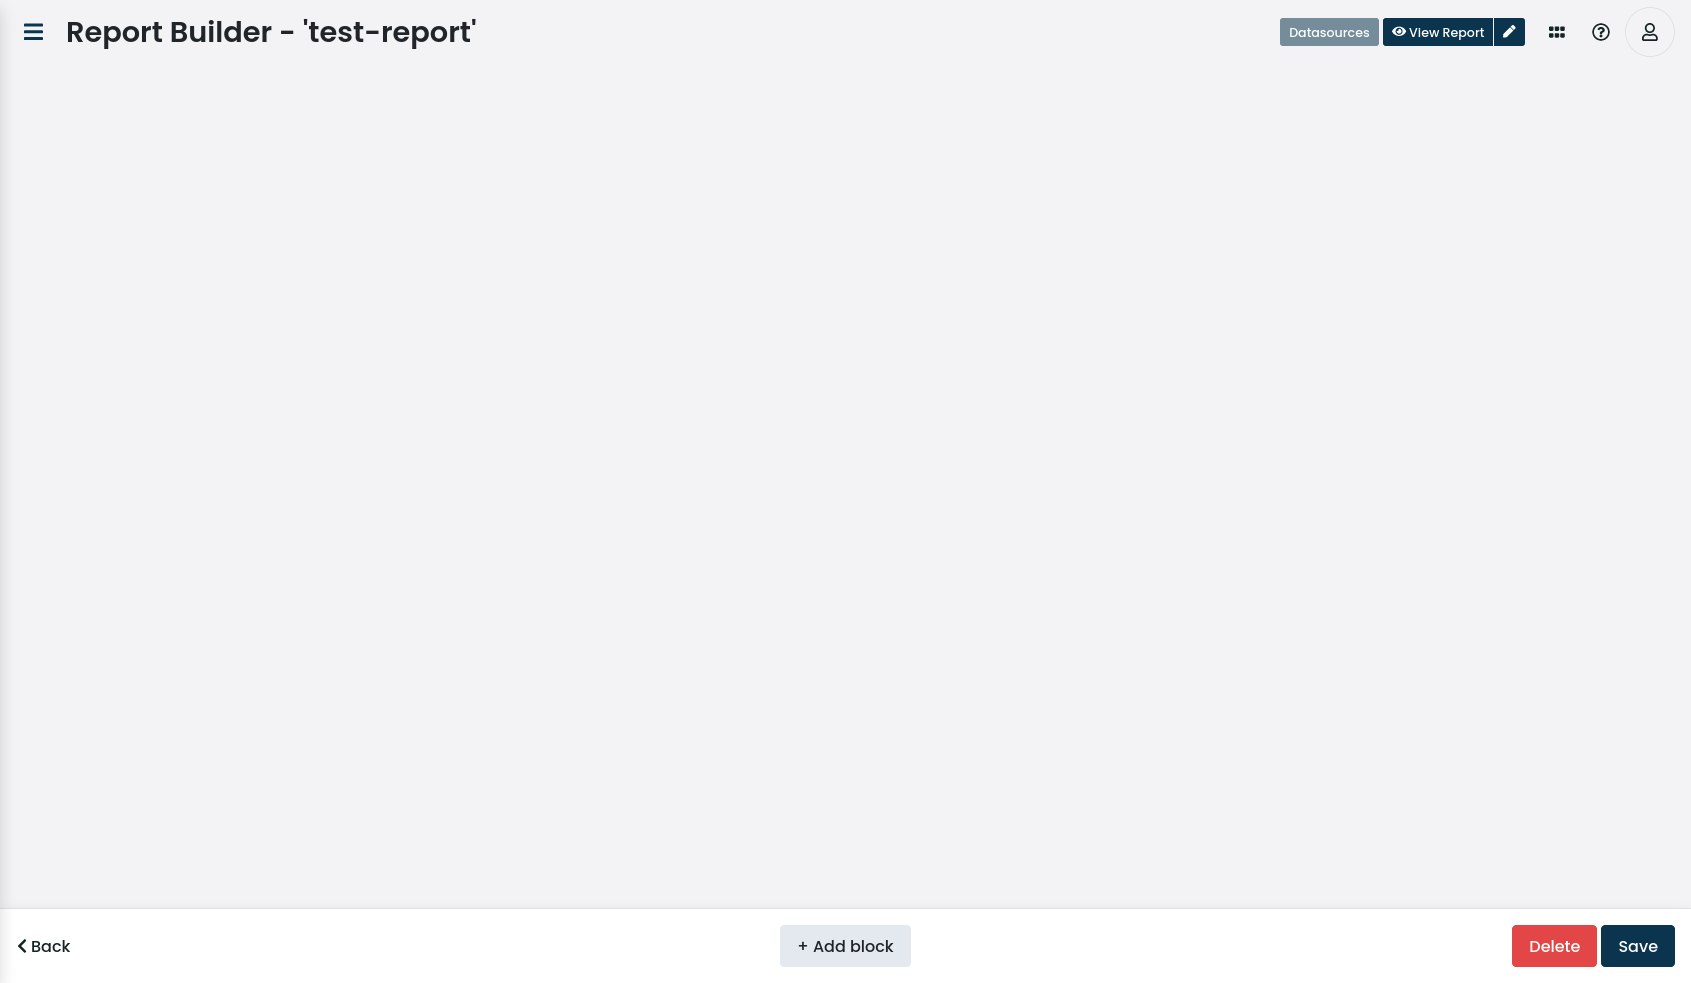
Click on the + Add block button to add a new report block which can hold additional datasources and display elements.

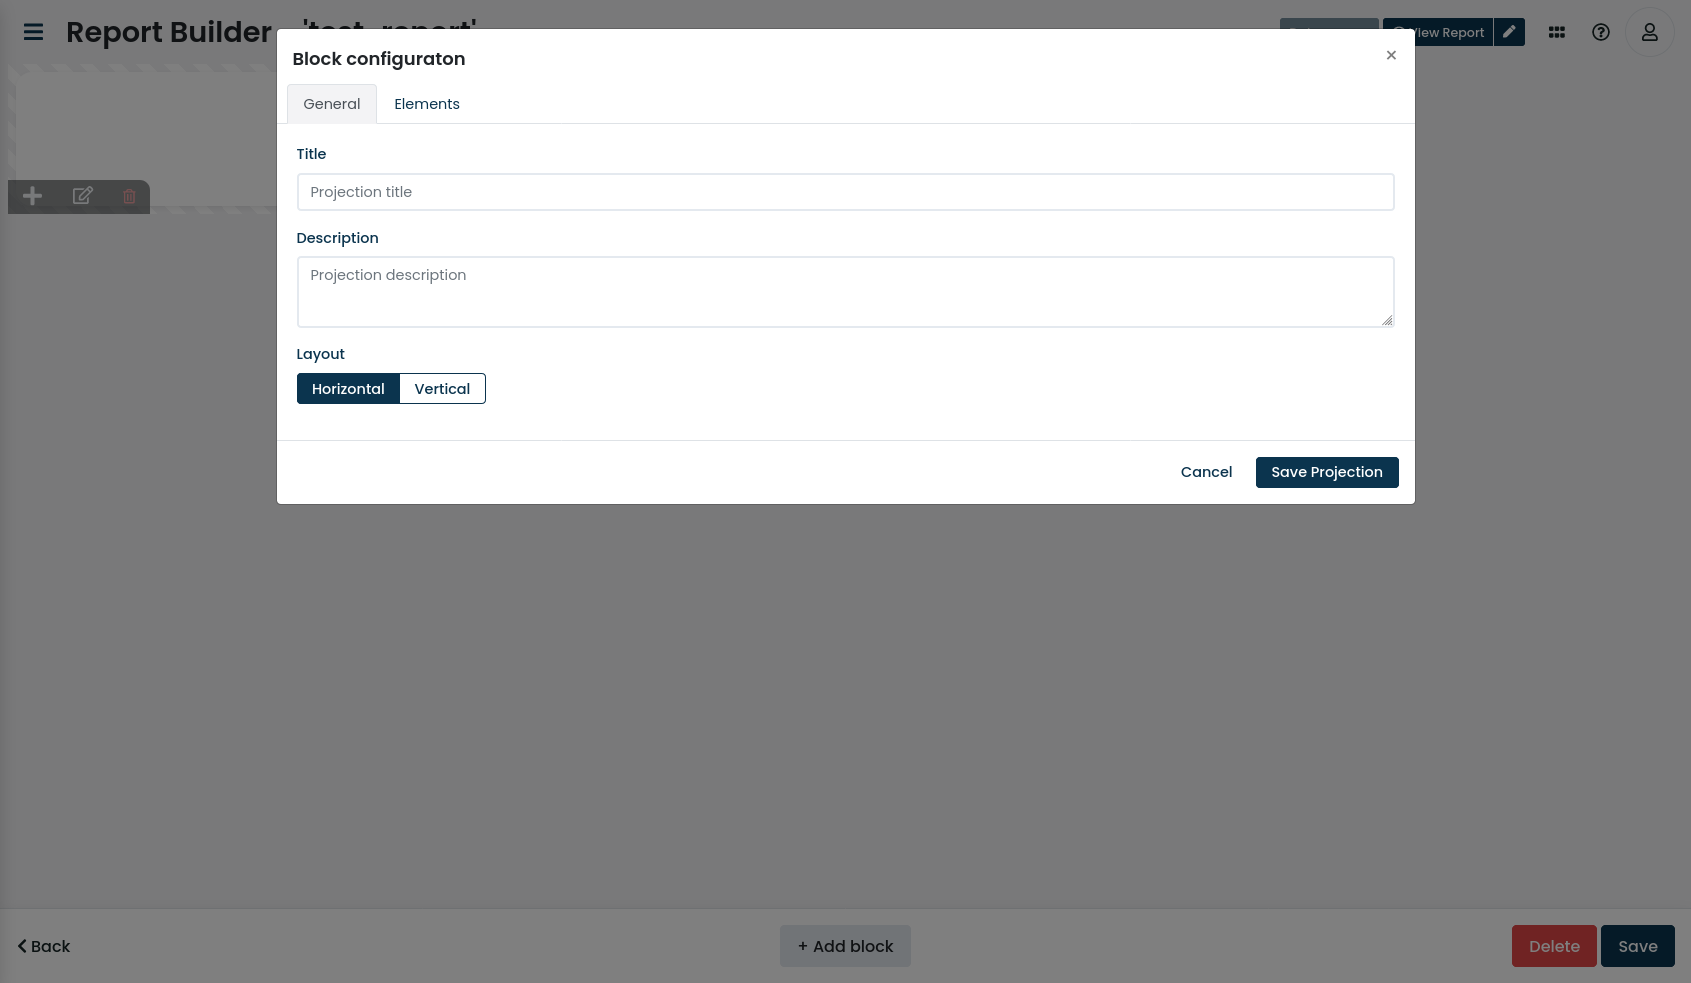
To access general report block configuration options (the title, description, and layout direction) click on the "edit" icon in the bottom left corner of the report block.
Display elements can be accessed, added, edited, and removed by navigating to the "elements" tab of the general report block configuration modal.
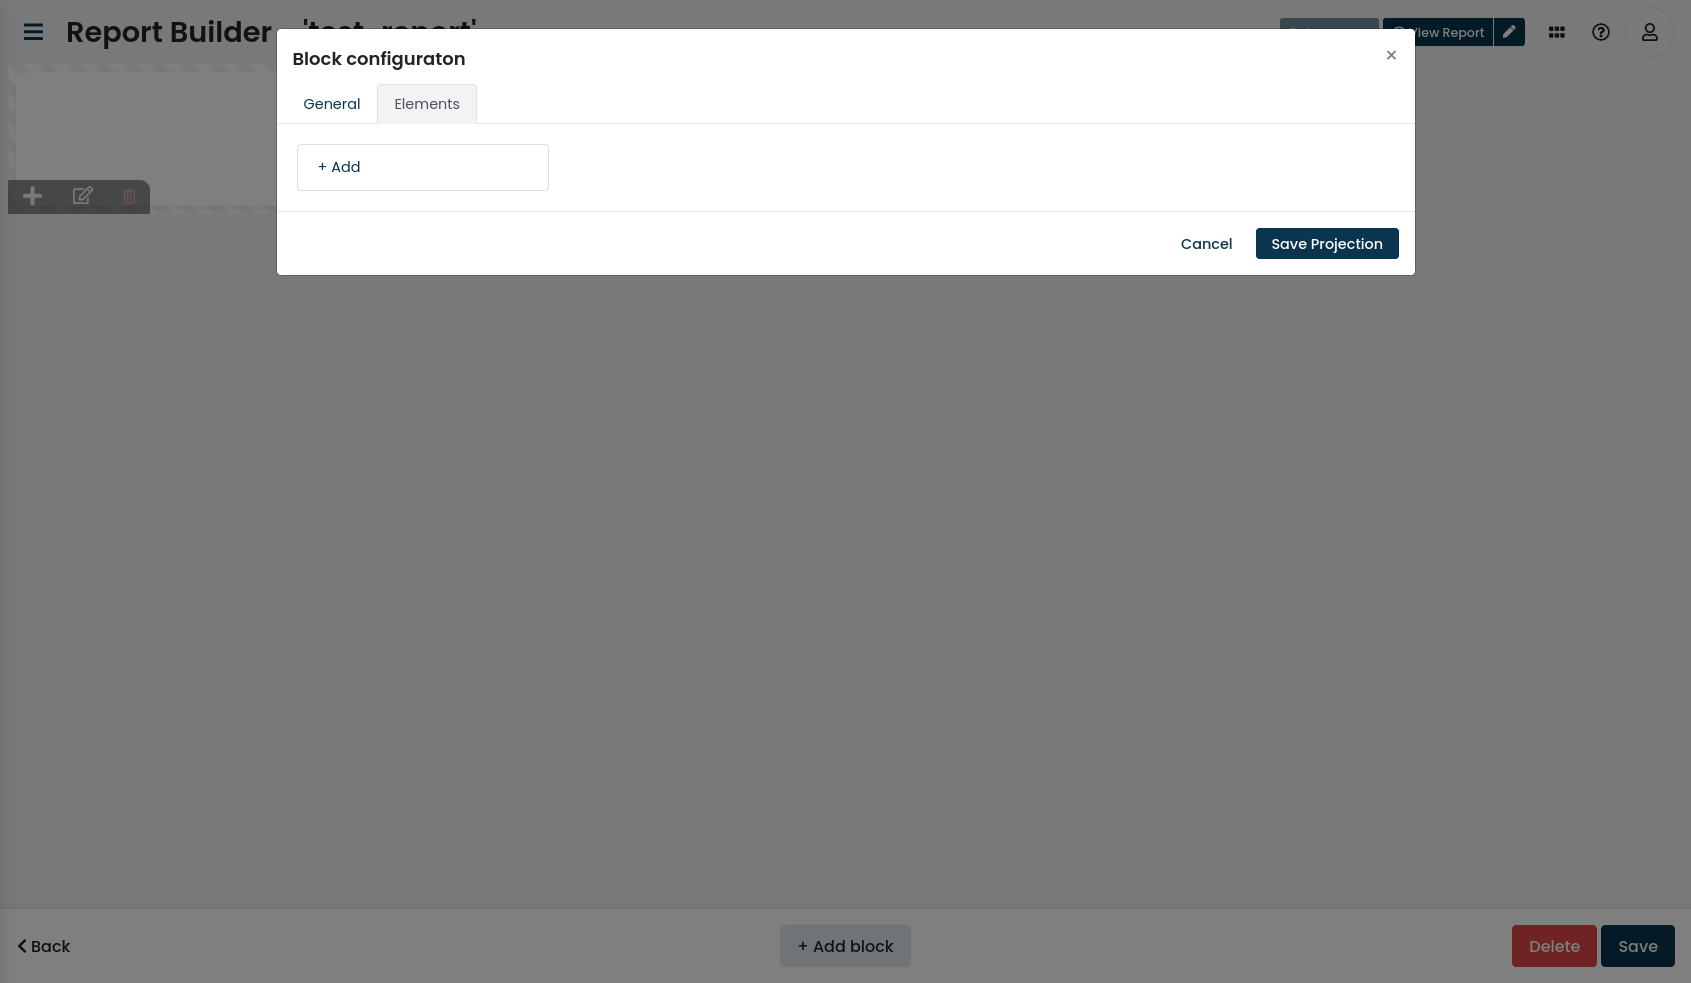
Display elements can quickly be added by clicking on the "add" icon in the bottom left corner of the report block.
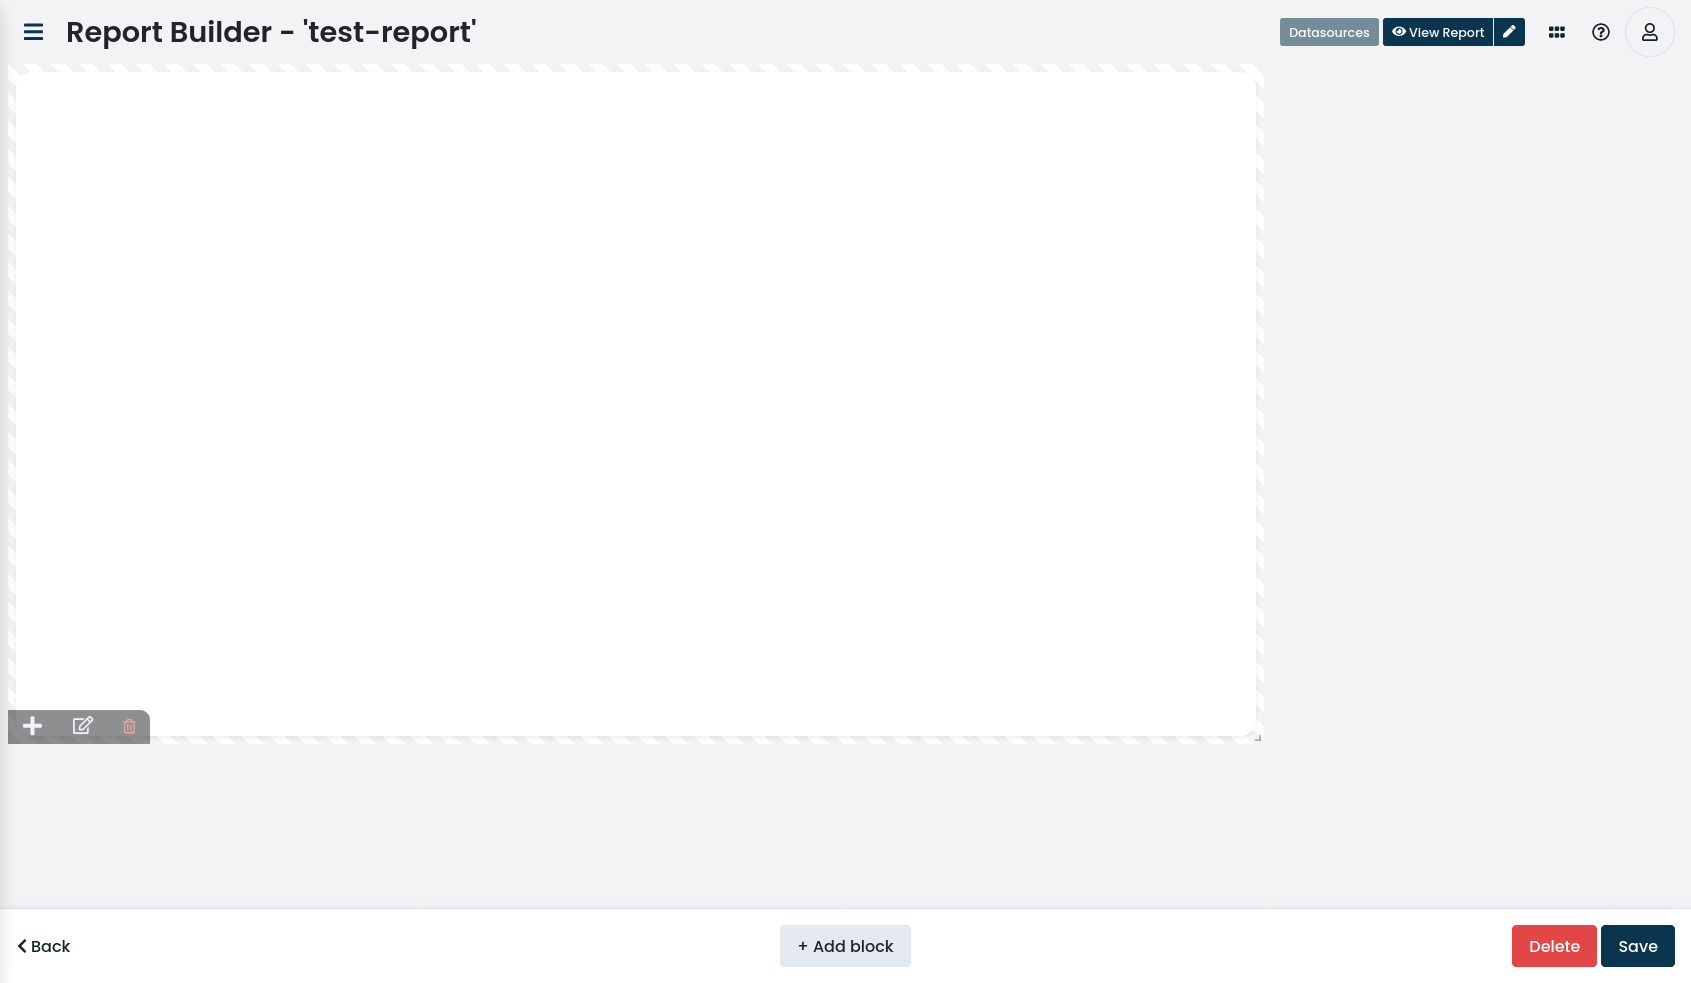
To reposition the report block, simply drag-and-drop it to the desired position.
The report block may be placed anywhere on the X axis, but its Y axis must connect with another report block or with the top of the page. If the position is not valid, or it overlays with another report block, they report builder may automatically adjust the surrounding report blocks to conform to the constraints.

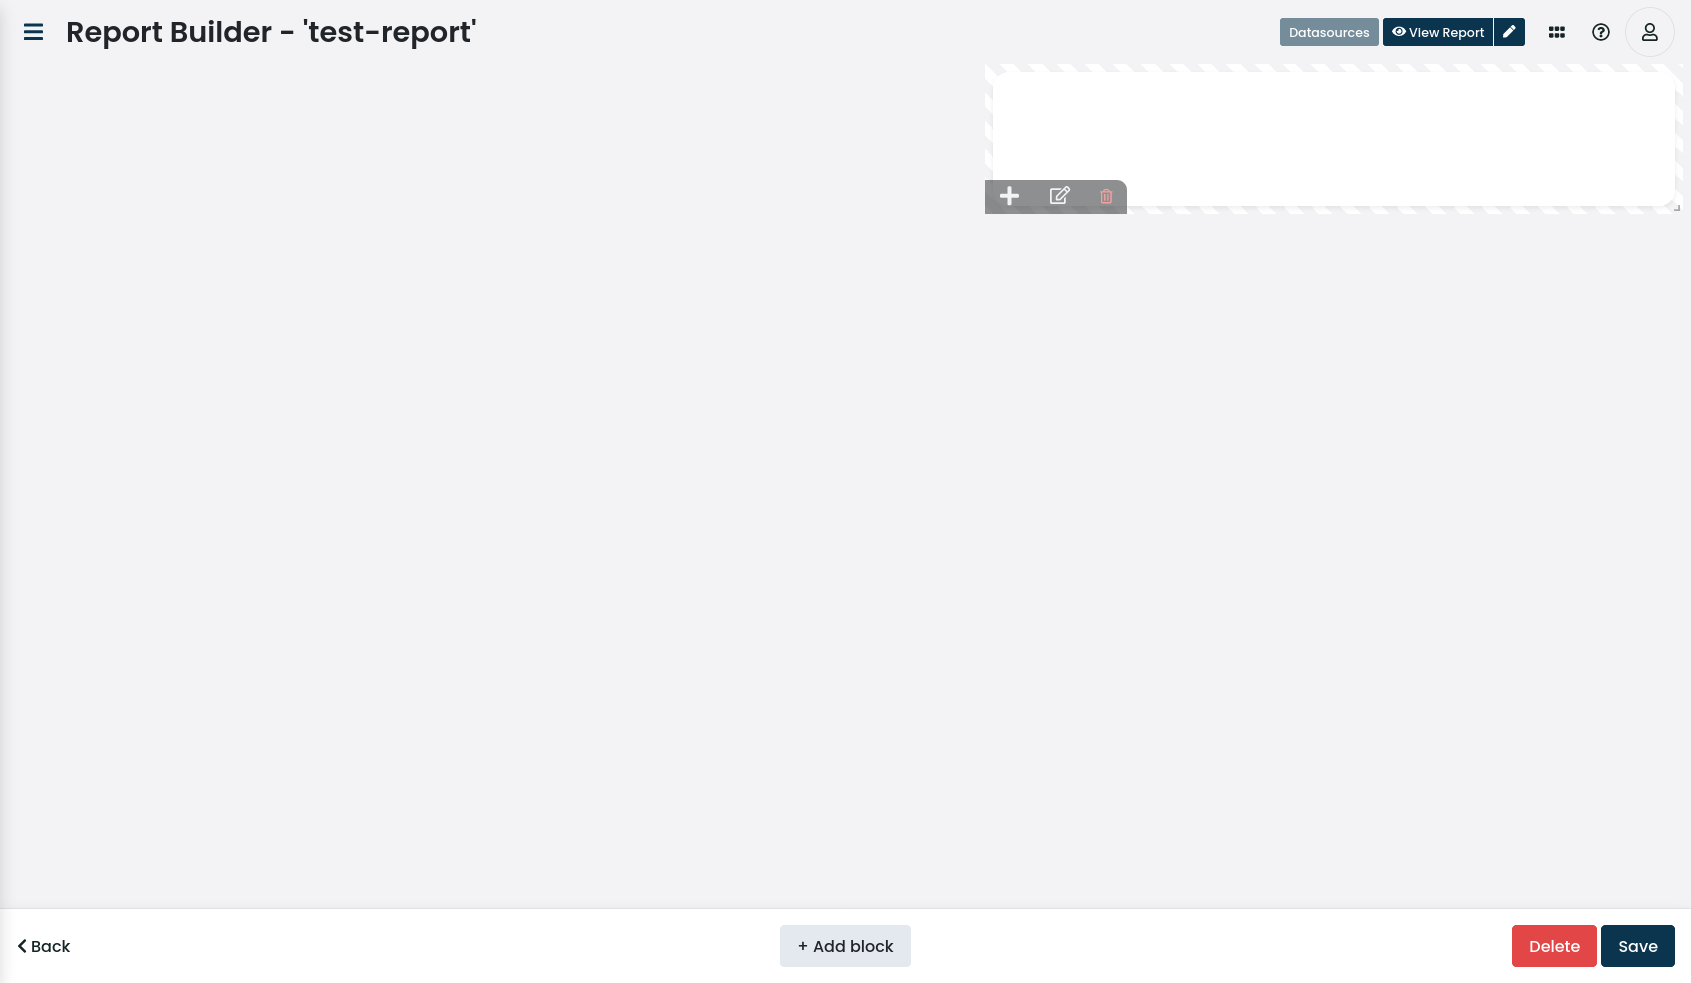
To resize the report block, simply grab the arrow in the bottom-right corner and resize to your needs. The report block may not exceed the maximum width of 12 columns. The height is not limited.
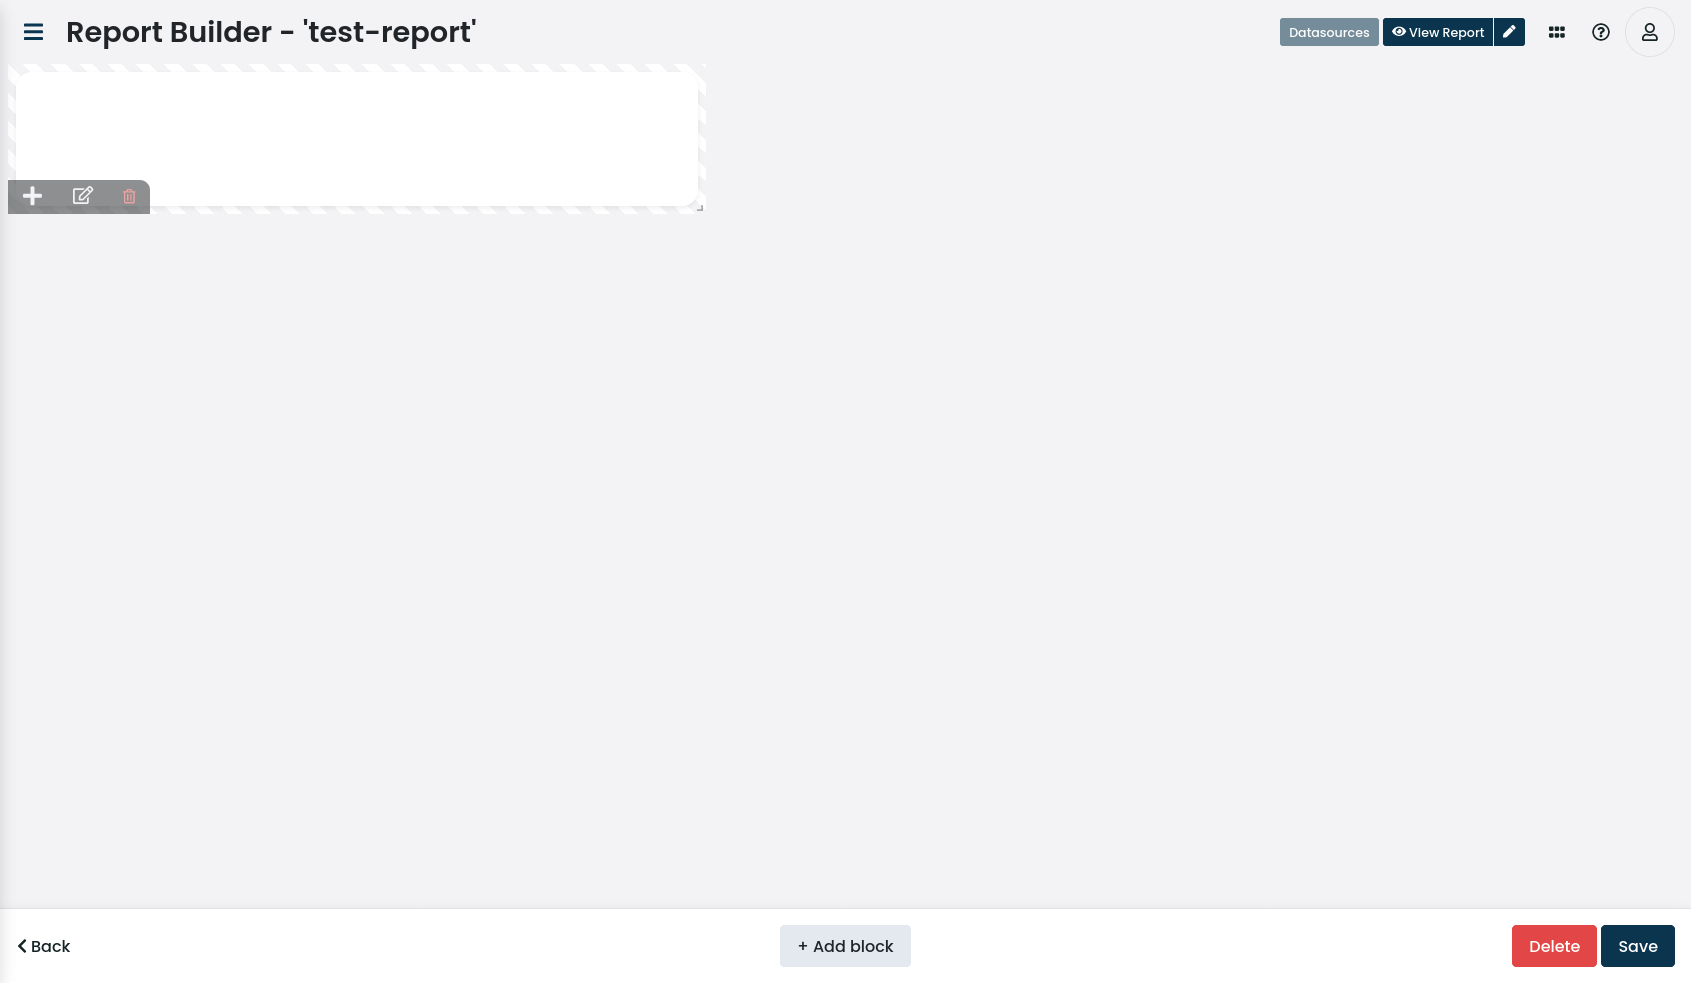
To delete a report block, click on the "trash can" icon in the bottom-left corner of the report block, and confirm the action by clicking on the confirmation button.

Datasources
|
DevNote reference to more examples. |
A datasoirce defines what resource we will be accessing, how the data will be pre-processed and presented to the reporter. Most datasources may be used as the input to another datasource.
|
A datasource must define a name that is unique amongst other datasources defined by the current report and any of it’s blocks. |
We can define datasources on two levels: on the entire report and on a specific report block.
When defining datasources on the entire report, any of the blocks and its items will be able to access the data provided by the datasource. Such a datasource should be used when we wish to define some pre-computed data which we will be using through the entire report. Report-level datasources can be accessed by clicking on the Datasources button in the top right corner of the report builder.
When defining datasoures on specific report blocks, only the items inside the given report block will be able to access the data provided by the datasource. Such a datasource should be used when we wish to additionally transform some pre-computed dat provided by report-level datasources. Block-level datasources can be accessed by clicking on the "edit" icon of a certain block and navigating to the "datasources" section.
Load
The load datasource allows you to access resources directly from Corteza such as your CRM leads.
The source defines what Corteza resource will be providing us with data; for example "compose records".
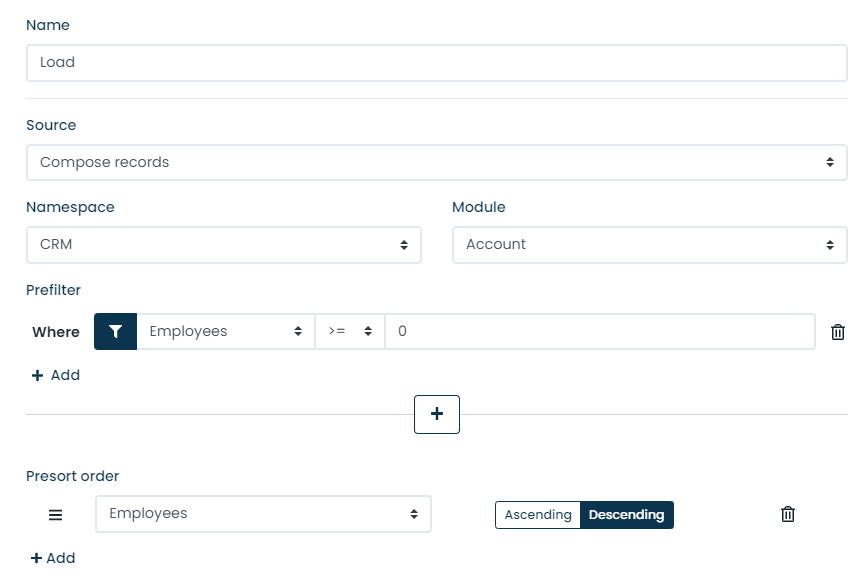
The namespace defines what Low Code namespace we will be accessing; for example "CRM" or "Case Management". |
|
The module defines what module we will be accessing; for example "lead" or "contact". |
|
The prefilter defines what filtering should be applied to the accessed data before the datasource returns the data. Prefiltering allows you to show data based on the specified heuristic, such as the current quarter or leads with a specific status. Refer to prefiltering for more details. |
|
The presort defines how the resulting data should be sorted before the datasource returns it. This allows you to define some initial order, such as newer leads first, or the oldest clients first. Refer to presorting for more details |
Group
The group datasource allows you to aggregate and transform data provided by another datasource, such as computing the total cost of lead acquisitions or counting the number of jobs that a client requested.
The source defines what datasource we will be aggregating and it must be one of the predefined datasources such as a load or another group.
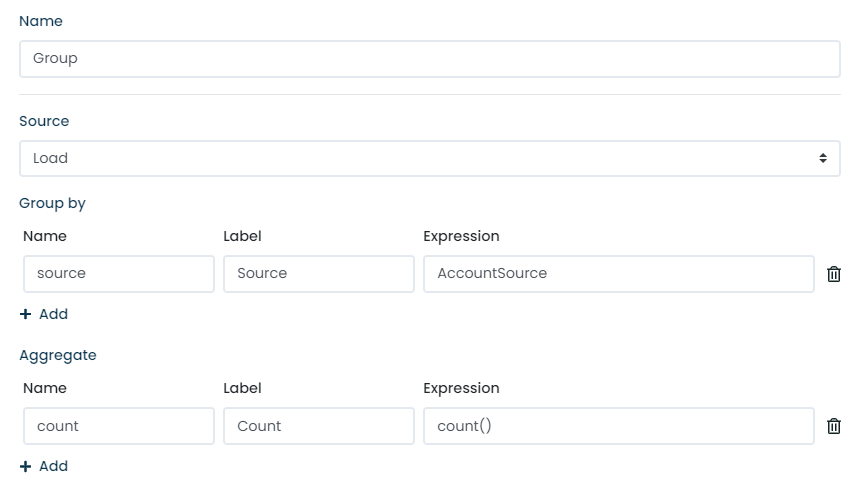
The group by section defines the columns that denote groups.
To examplify; defining an expression of The group column must define a name and an optional label; and can be referenced by further datasources. Refer to the expression reference for more details.
|
|||
The aggregate section allows you to define how the computed columns are be evaluated.
To examplify; defining an expression of The aggregated column must define a name and an optional label; and can be referenced by further datasources. Refer to the expression reference for more details.
|
Join
The join datasource allows you to join two datasources based on a common value, such as a reference using Record module fields or a common status column.
|
The current versions do not allow you to use the join datasource as an input to other datasources. |
|
Any row from the primary source which does not have a related secondary source will be omitted from the result. Anti-joins are not supported. |
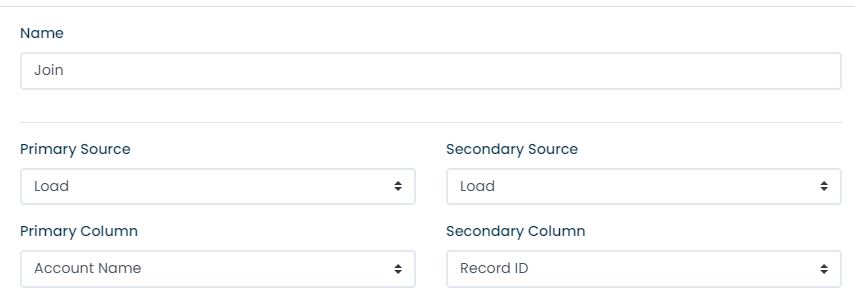
The primary source defines the base datasource involved with the joining, such as the account of the account-contact relationship. |
|
The primary column defines what column from the primary source should be used when determining if the two rows are connected. |
|
The secondary source defines the datasource which we are trying to join to the primary source, such as the contact of the account-contact relationship. |
|
The secondary column defines what column from the secondary source should be used when determining if the two rows are connected. |
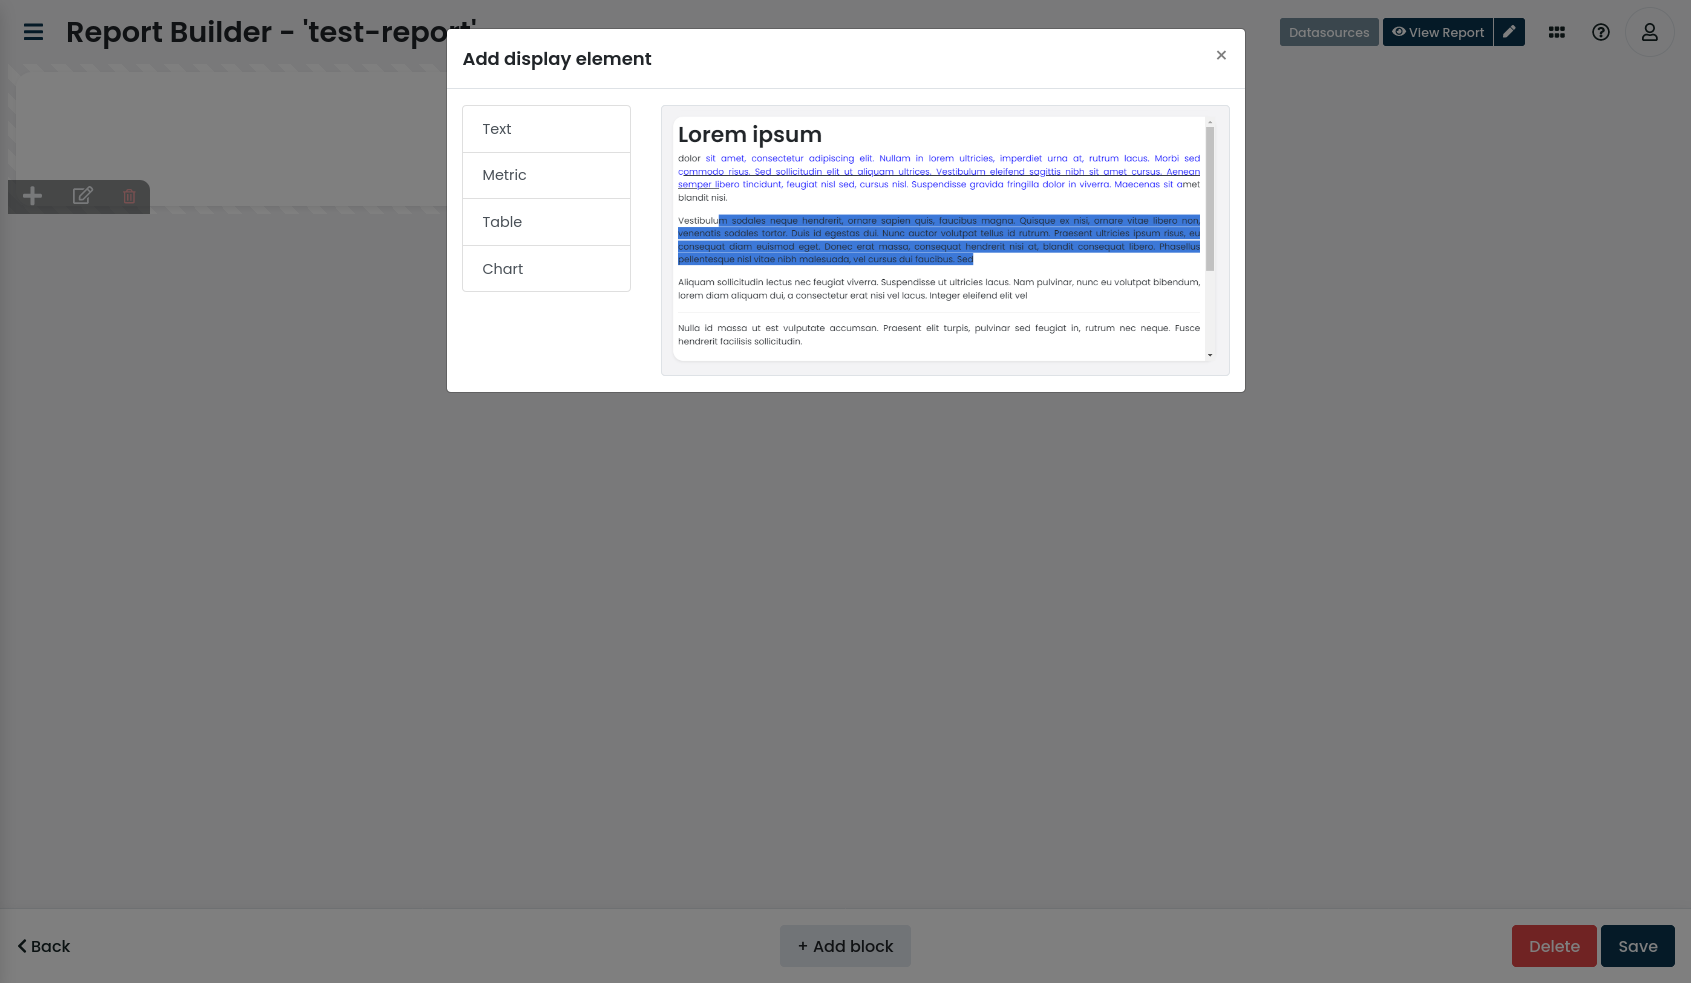
Display elements
Display elements allow you to access and display the data provided by a datasource. Display elements can only exist inside a block, where a single block may define multiple display elements.
Most display elements may define additional prefiltering and presorting.
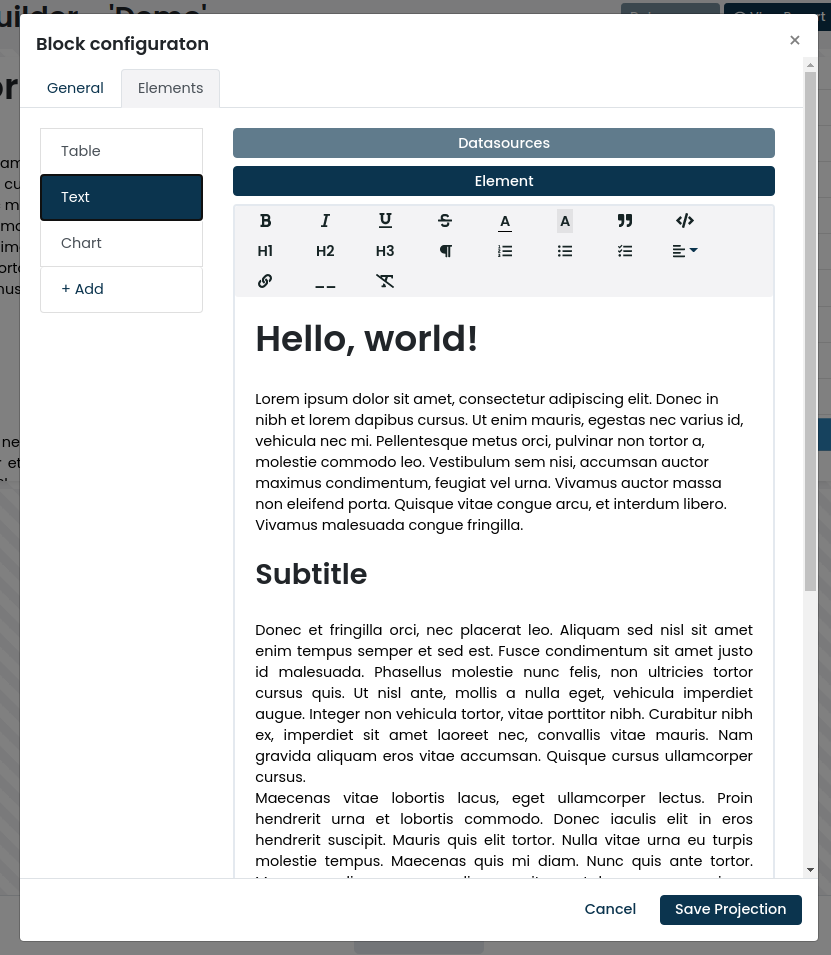
Text
The text display element allows you to provide arbitrary content which can be used along side other display elements, providing additional context to the data.
The display element supports rich text using a WYSIWYG editor.
Metric
The metric display element allows you to display a calculated numerical value from the provided datasource.
The calculated value is usually an indicator important to your process, such as the total finances in your sales pipeline, or the current number of open accounts.
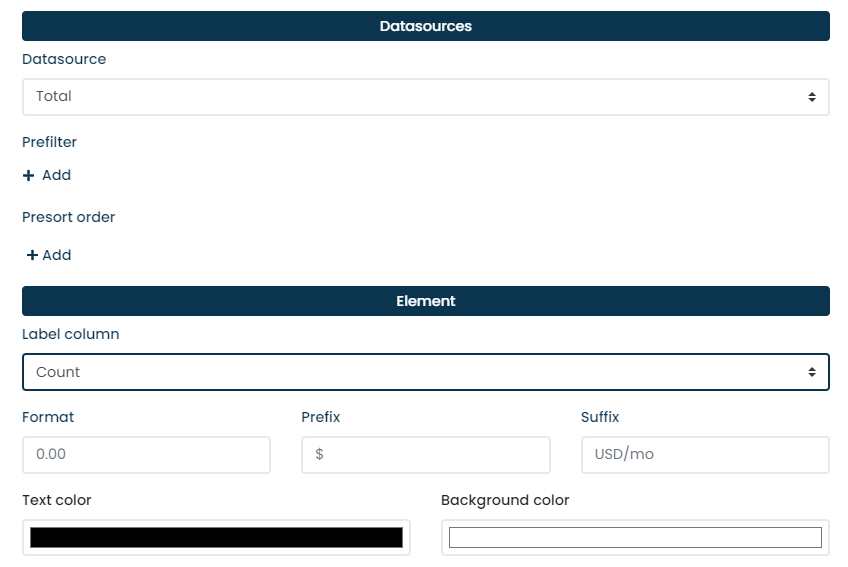
The label column defines what column from the datasource will be used when displaying the metric. The column must be a numerical value. |
|
Defines the formatting string that is used when displaying the metric. The field supports all of the numeral.js formatting options. The format is applied before the prefix and suffix. |
|
Defines the prefix that is pre-pended to the resulting metric before it is shown in the page block.
For example, the prefix of |
|
Defines the suffix that is appended to the resulting metric before it is shown in the page block.
For example, the suffix of |
|
Defines the text color of the displayed label. |
|
Defines the background color of the displayed label. |
Table
The table display element allows you to display the datasource inside a table.
|
If you are working with a joined datasource, you will have to have to pick the columns for each joined datasource |
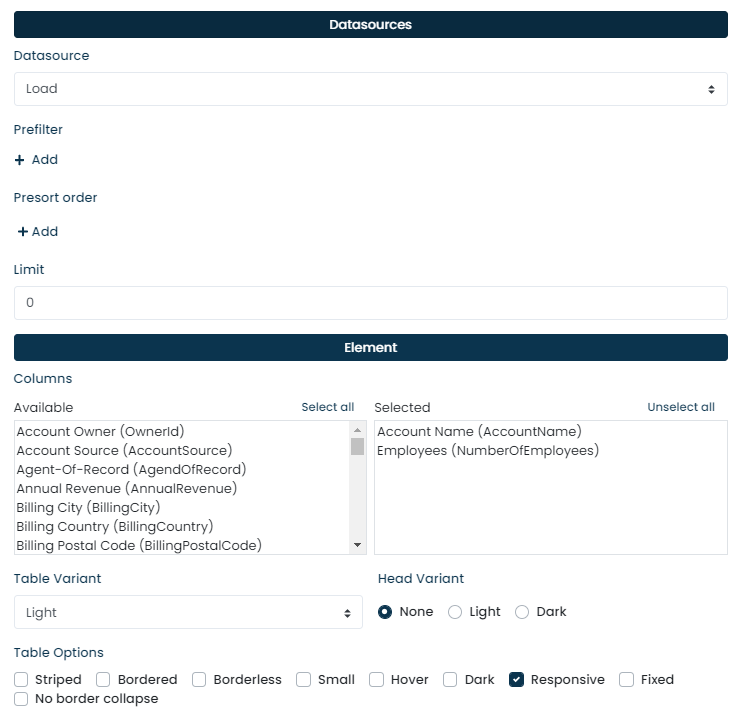
Defines what columns from the datasource should be used and how their order. |
|
Defines the variant of the table to use. The available variants:
|
|
Defines the head variant to use. The available variants:
|
|
The section allows you to fine-tune how the table should look like; such as using a dark or light theme, removing borders, and being responsive. |
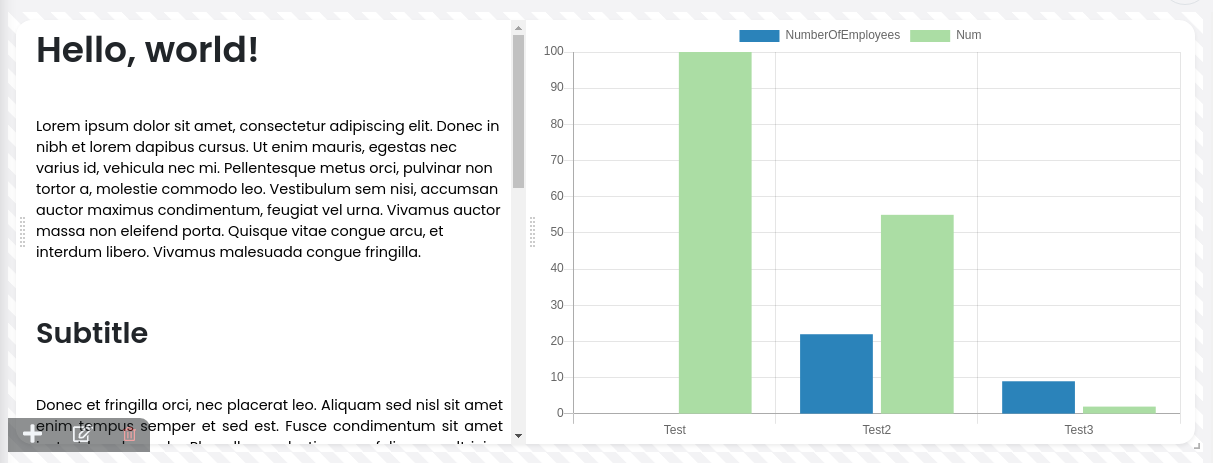
Chart
The chart display element allows you to visualize the datasource using a chart.
|
If you are working with a joined datasource, you will have to have to pick the columns for each joined datasource |
-
Bar
-
Line
-
Pie
-
Doughnut
-
Funnel
|
Funnel charts are only supported when showing the group datasource. |
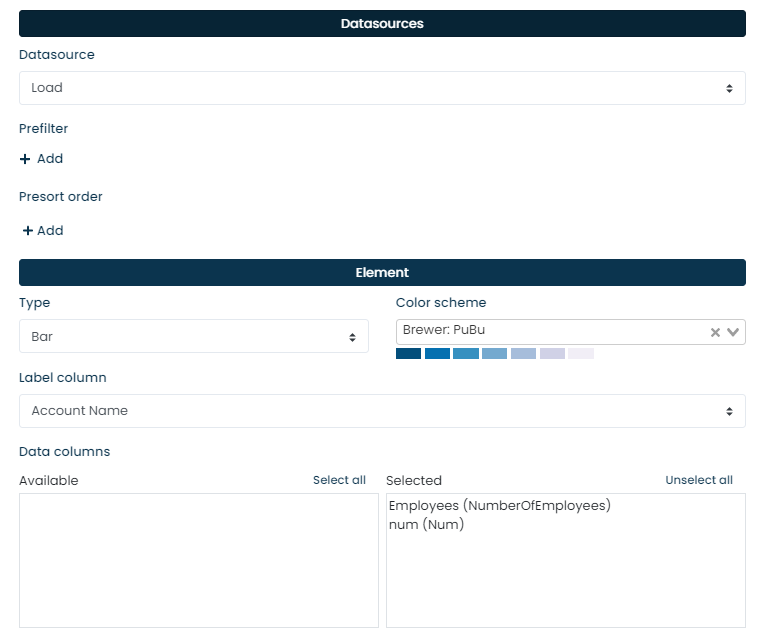
Defines what chart from the supported list of charts should be used. |
|
The color scheme defines what colors your chart should use when visualizing the data. Keep in mind that each color scheme defines a limited number of colors so your choice needs to be based on the data you’re trying to show. Bar and line charts use a different colour for each column, while the other charts will use a different color for each value. |
|
The label column defines what values from the datasource will be used as the label for each data point of the chart (the legend). Only text columns may be selected as a label column. |
|
The data columns define what values from the datasource will be used as the data points of the chart. Only numeric columns may be selected as a data column. |