Messagebus Queue
Messagebus queue mechanism complements the workflows in a way that any asynchronous computation can be offloaded to another workflow or workflow-extendable process. More info on the described topics can be found at Workflows, Integration Gateway Route Profiler and the Messagebus subsystem.
-
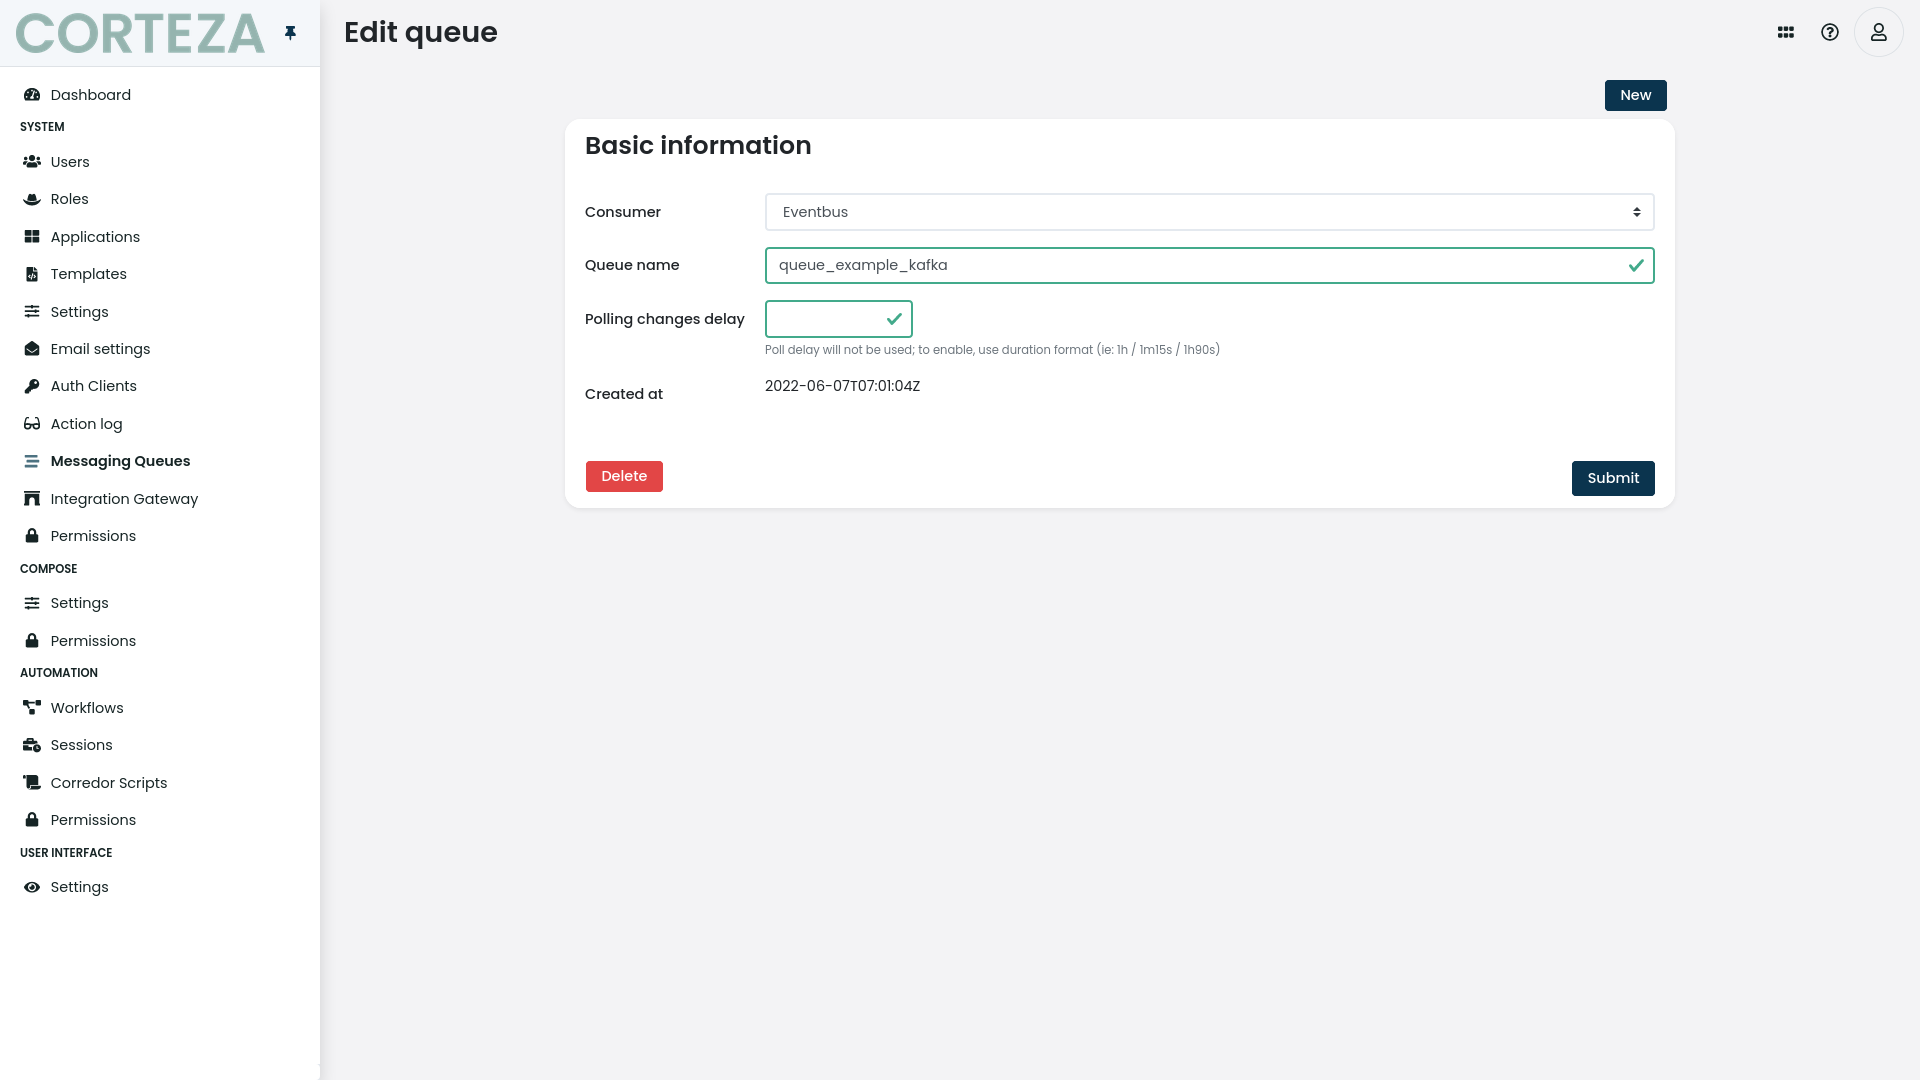
create a queue
-
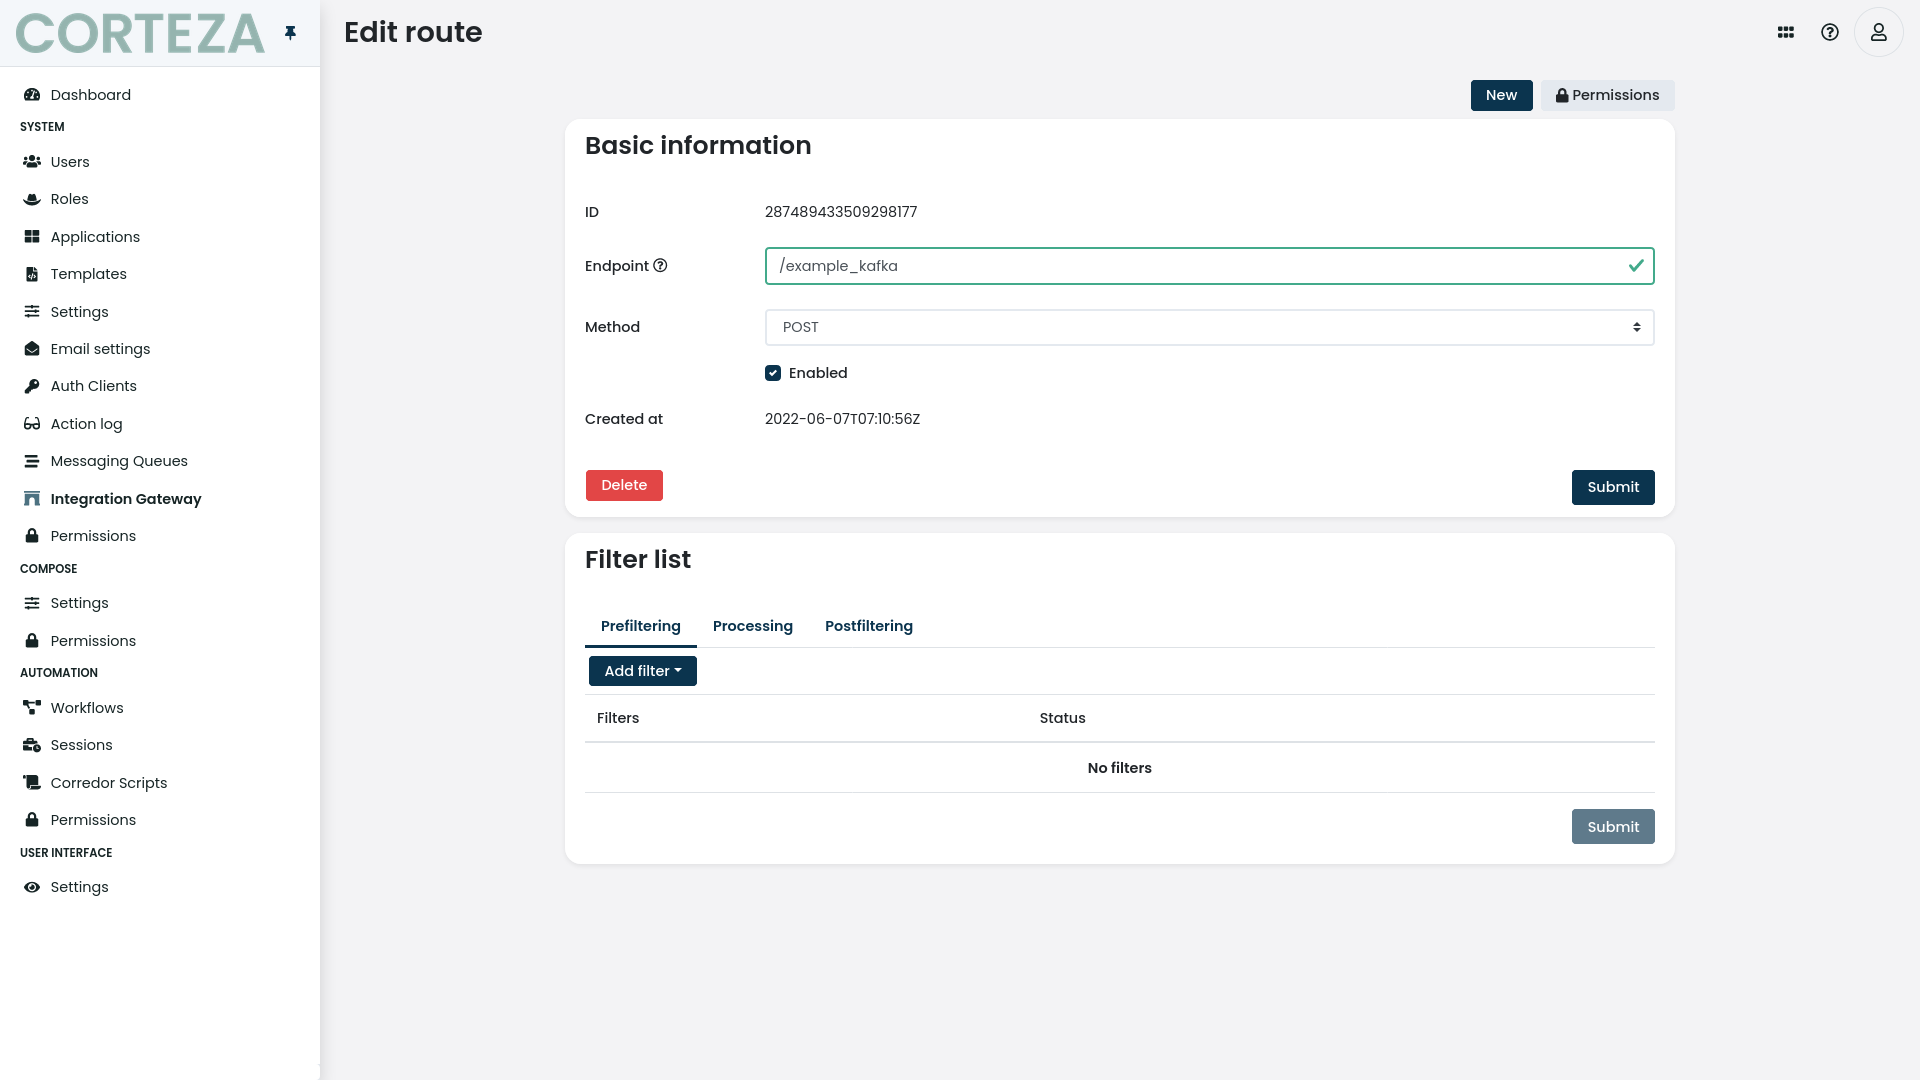
create an endpoint
-
write to queue via workflow
-
read from queue via workflow
-
send a payload to an endpoint
-
-
view endpoint payload in profiler
Create a new Queue
|
The |
Write to Queue
This is a workflow we will use just to manually trigger the write to queue.
|
You can either use any of the automation buttons to trigger this workflow from the UI. Usually the case would be after creating a record and then sending the new recordID to the queue. |
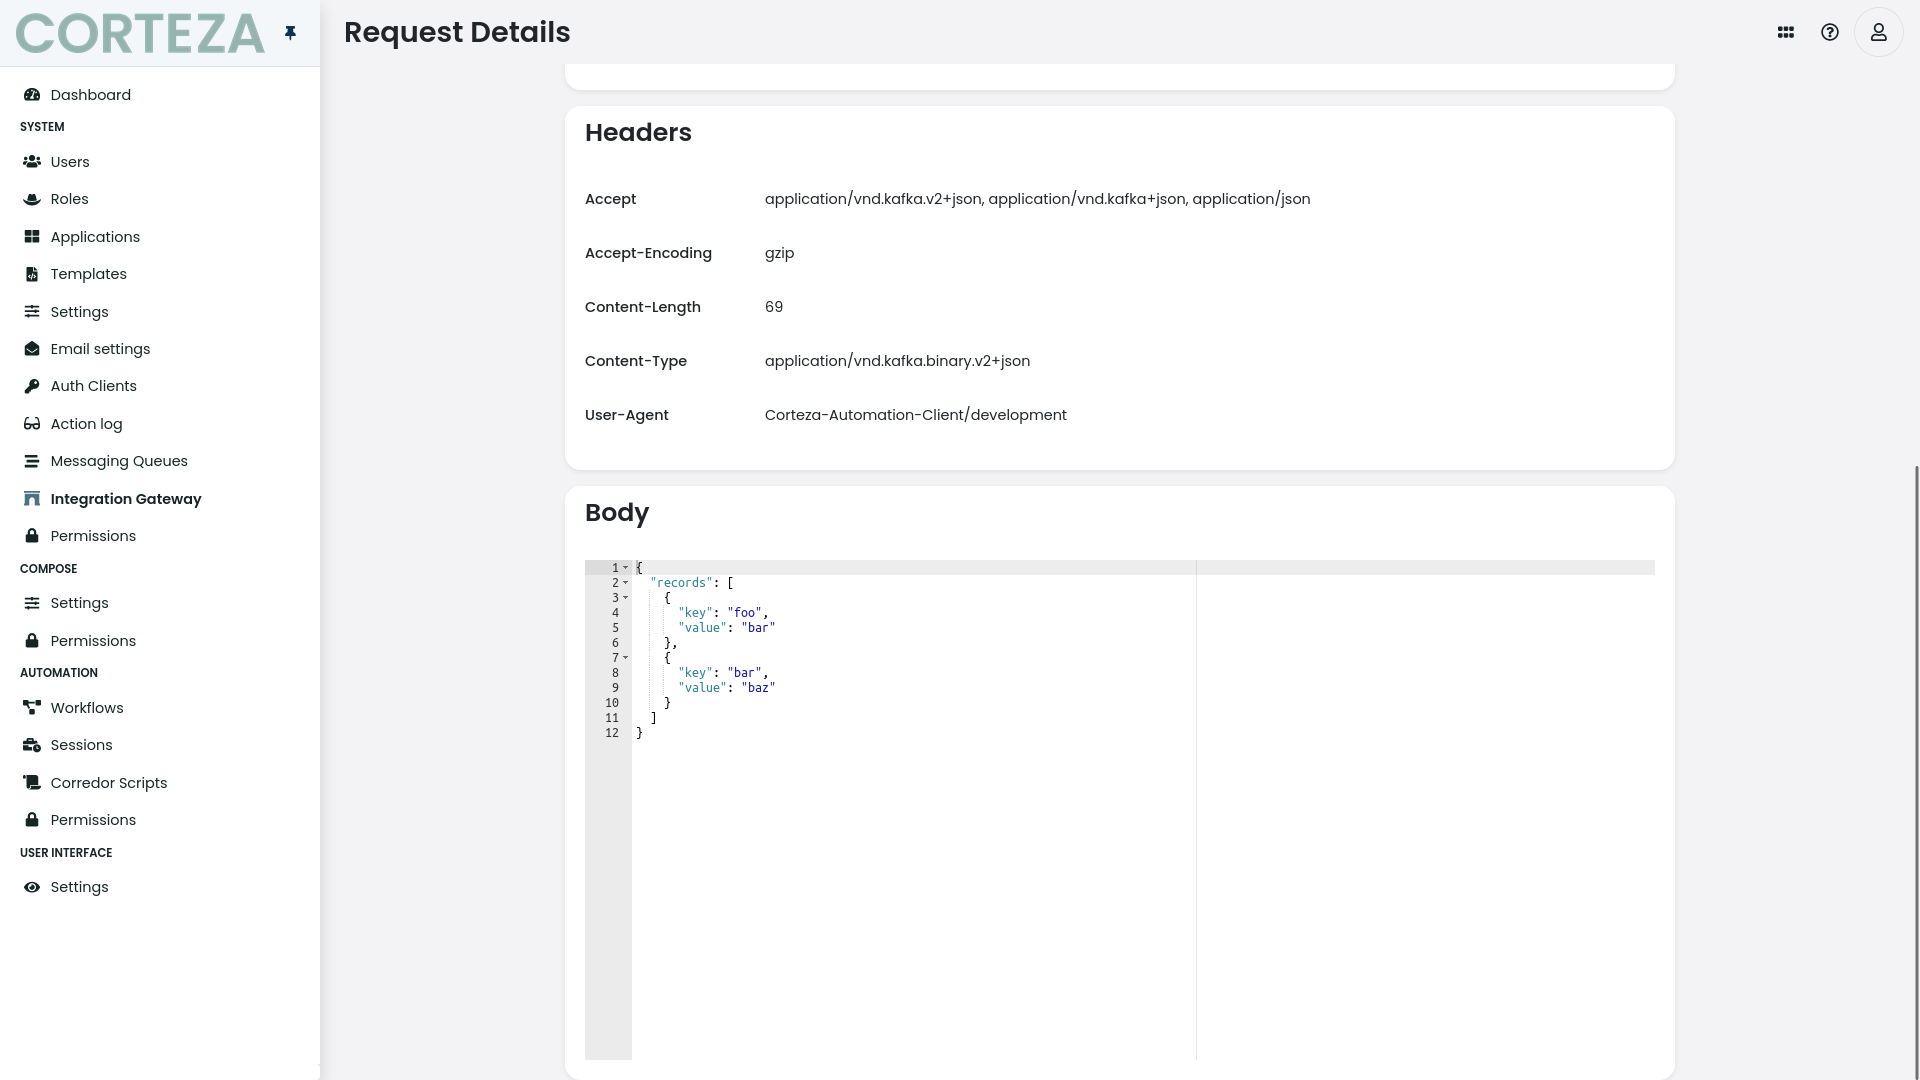
The payload is defined as an Array that is then stringified
toJSON([
  {"key":"foo", "value": "bar"},
  {"key":"bar", "value": "baz"}
])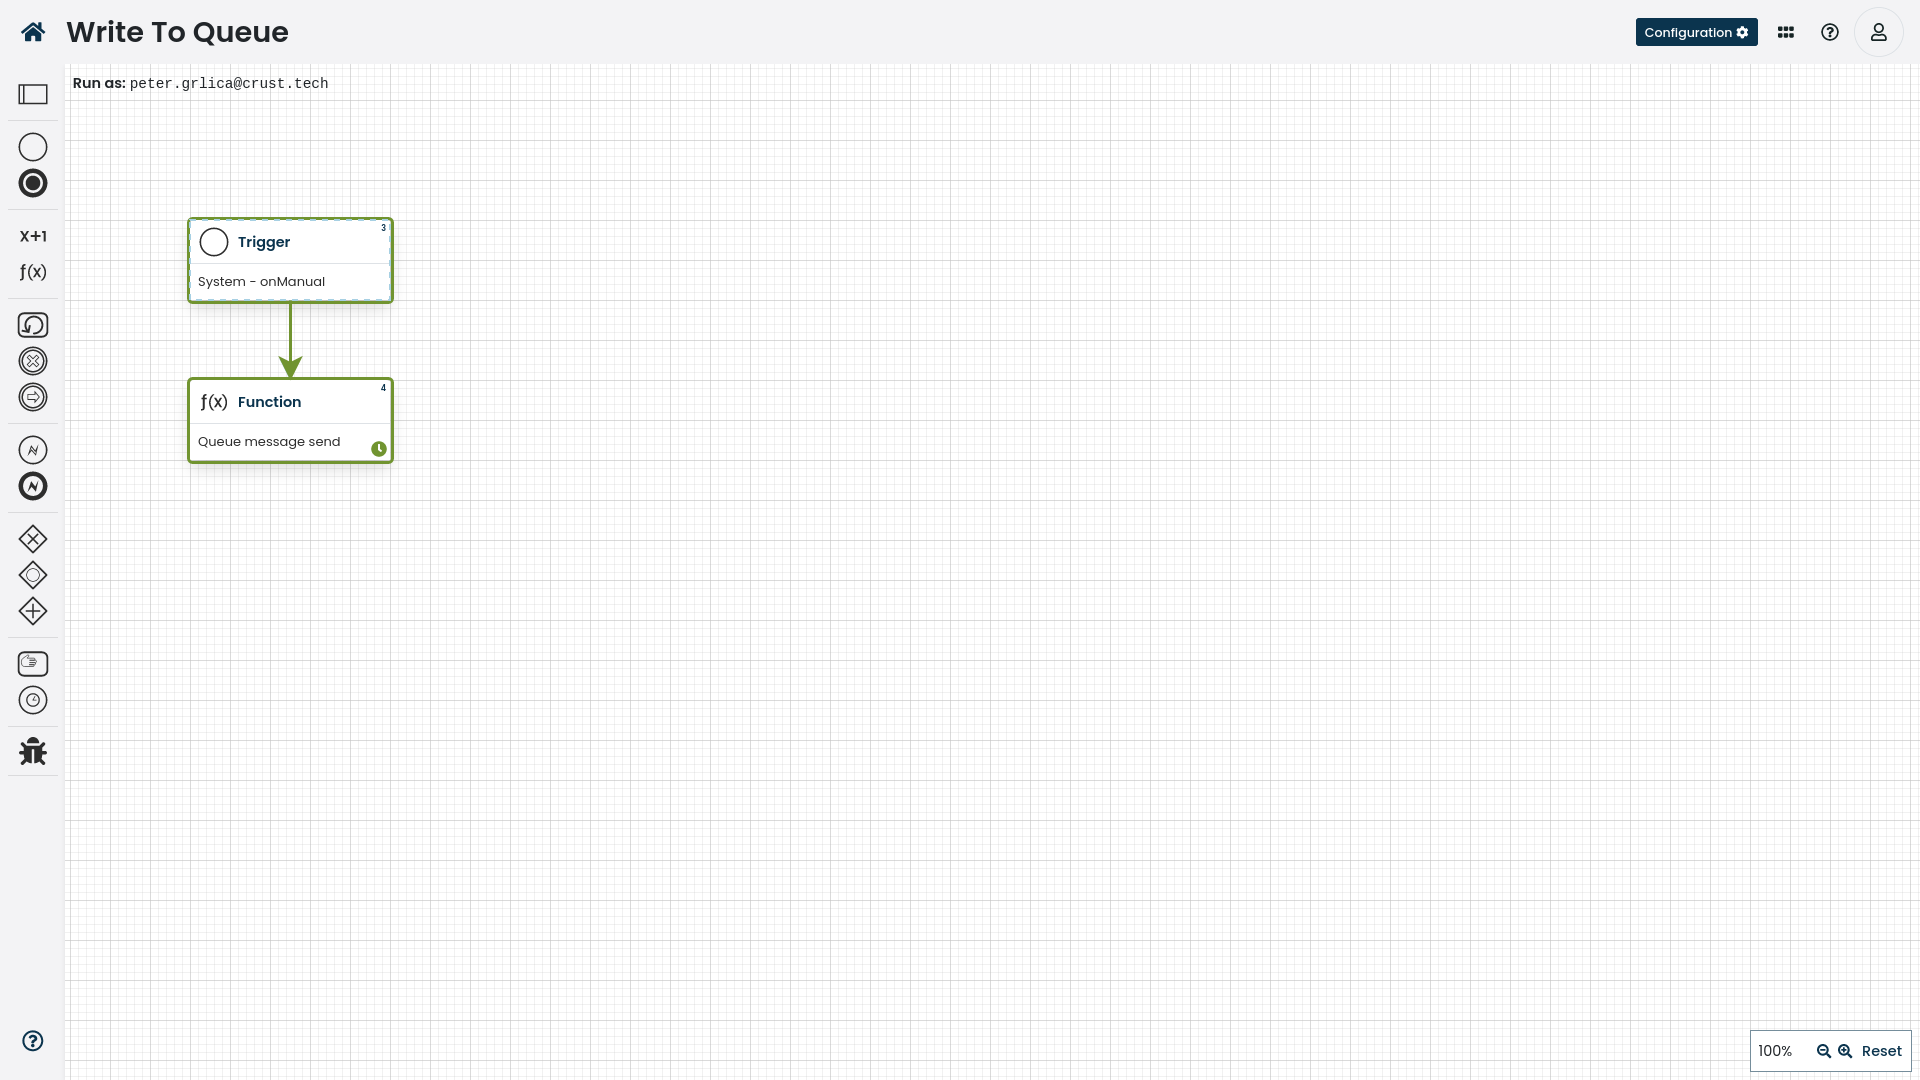
The source code for the workflow example.
Read from Queue
Here we parse the queue payload and create a custom HTTP request to an outside, ie. Kafka (in our example an endpoint we will create for this purpose only).
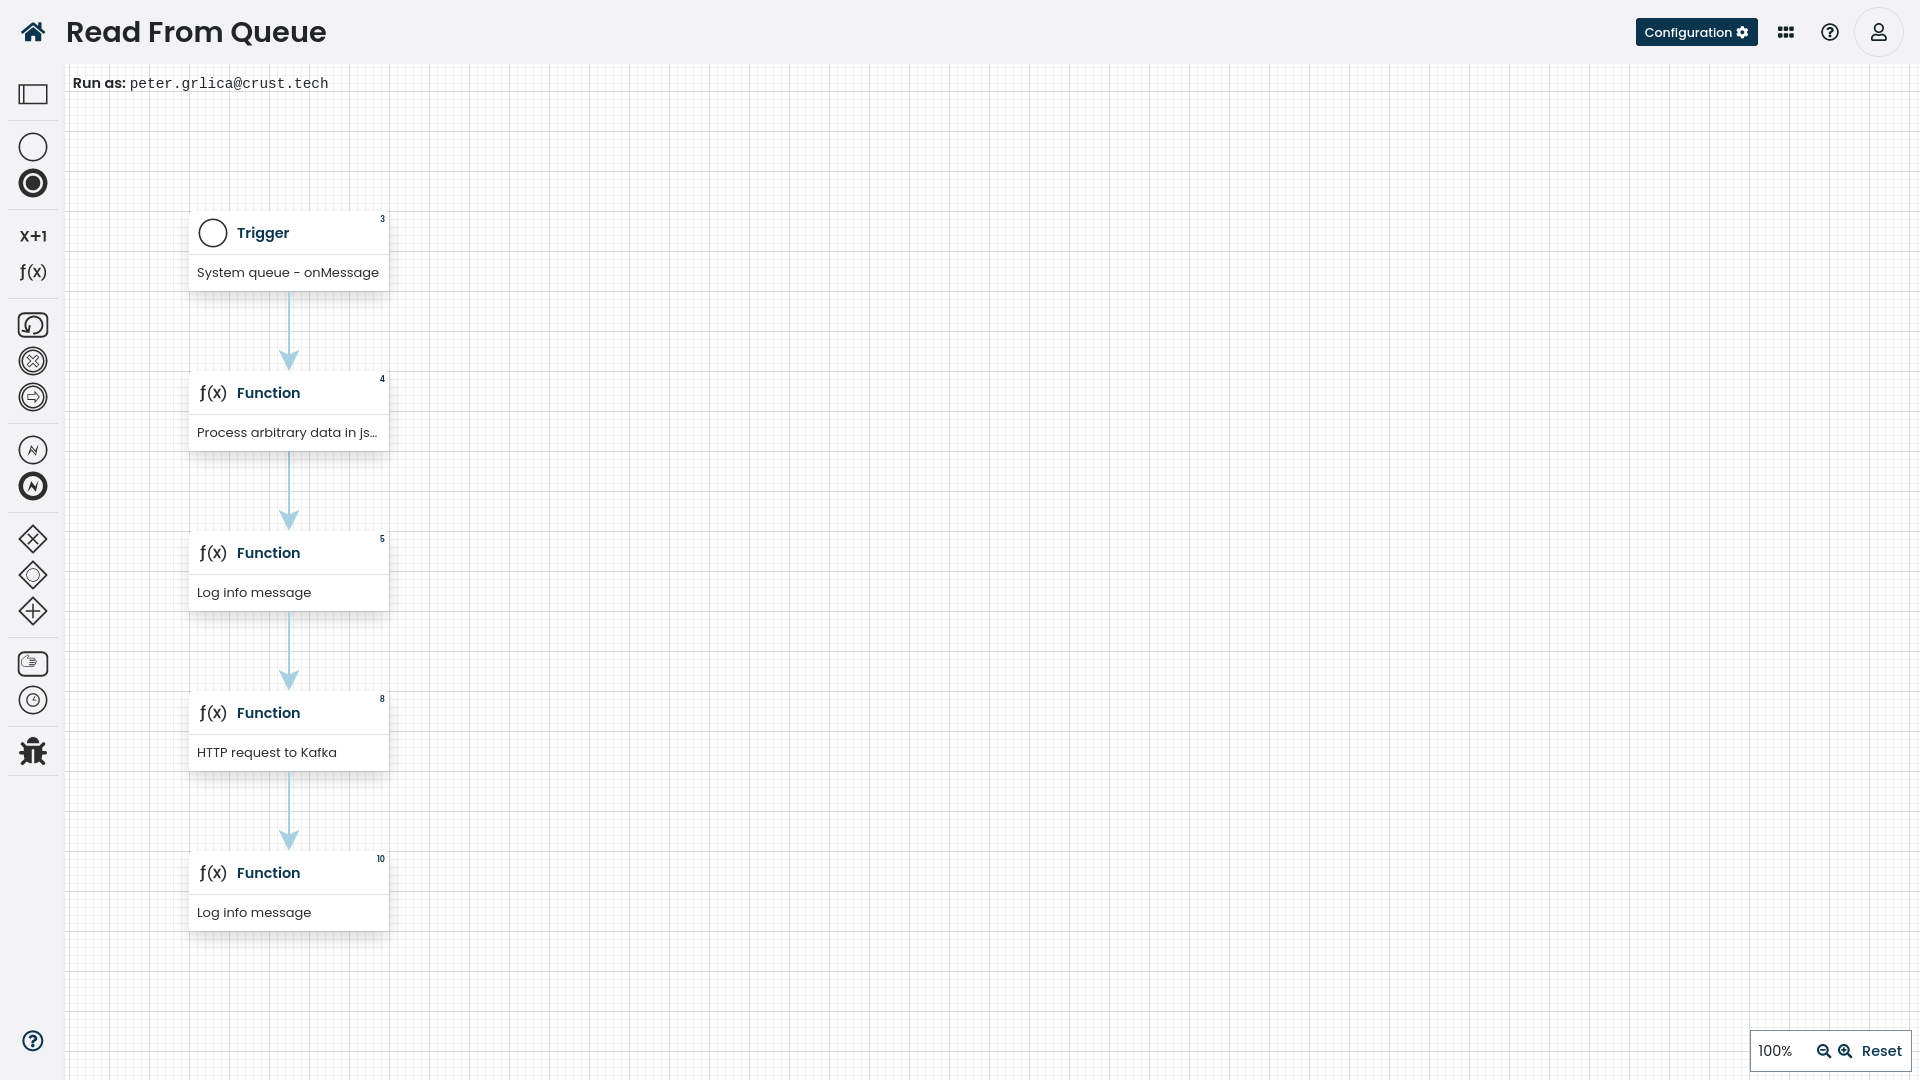
The source code for the workflow example.
Create a mock service endpoint
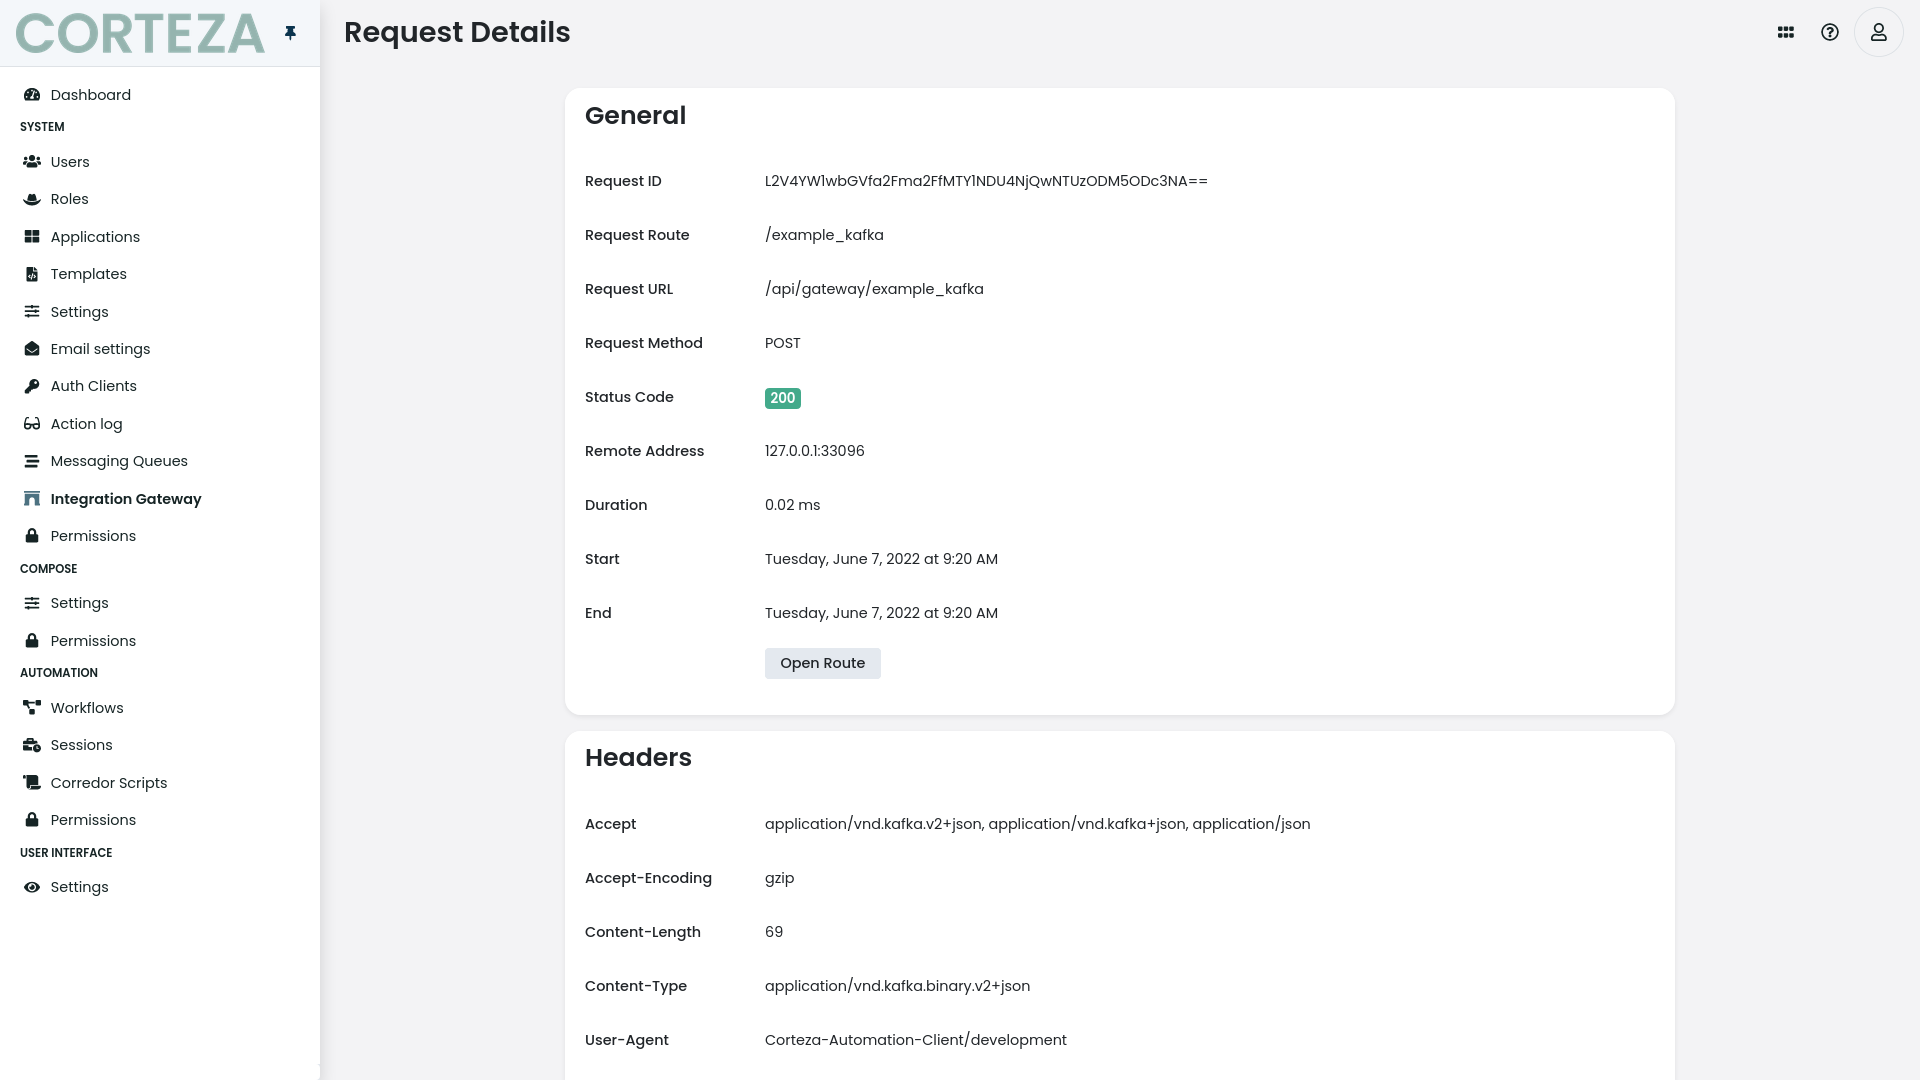
What we need now is to trigger the Queue Write workflow and a request will be sent to our local server on the /api/gateway/example_kafka endpoint.
The resulting request can be seen on the Integration Gateway profiler (if you have it enabled, see more at Route Profiler).