Testing and Debugging Workflows
Testing
Testing is a powerful and essential component of any project.
|
The testing approach mentioned below doesn’t sandbox your data in any way. Any changes performed by the workflow are reflected in the system. |
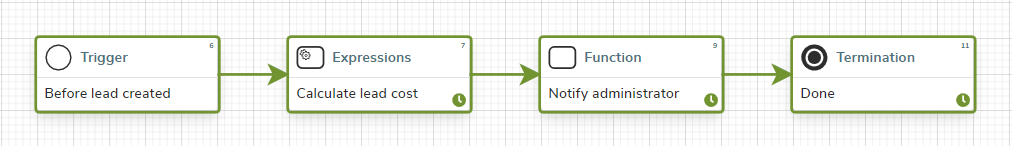
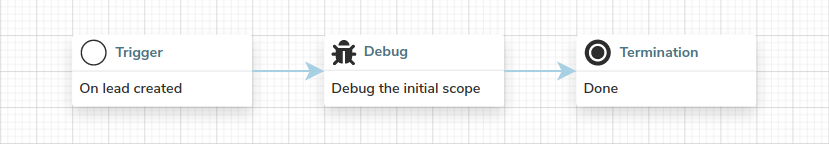
Let us look at an example. You want to implement a workflow that calculates the cost of a newly created lead. The cost of the lead is sent as an email to the administrator.
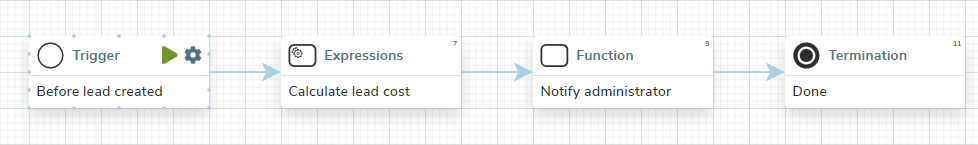
To test the workflow, click on the play icon  in the top right corner of the trigger.
Only saved and valid workflows can be run.
in the top right corner of the trigger.
Only saved and valid workflows can be run.
A pop-up asking for the initial scope appears. The initial scope is data passed to the workflow to perform an operation.
|
The initial scope depends on the resource and event type. |
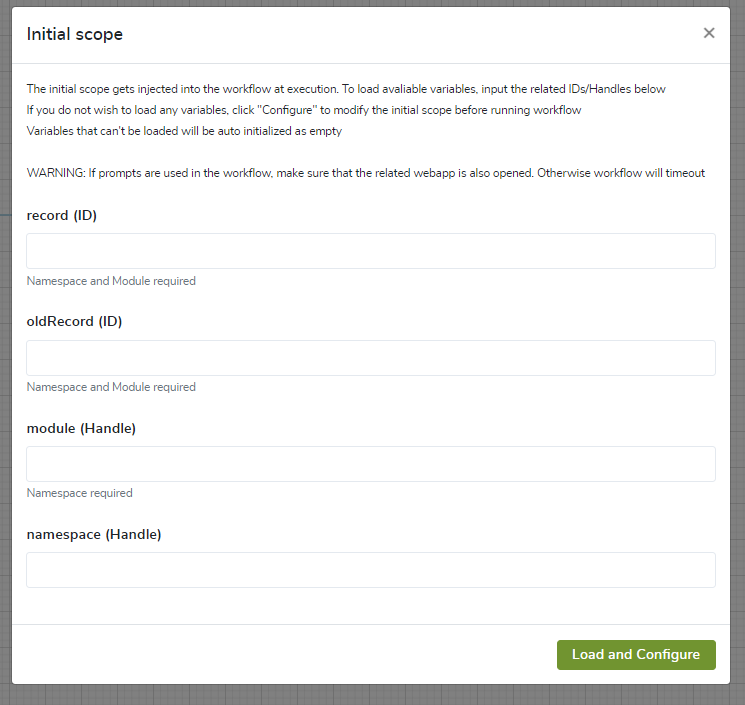
Insert the required parameters and click on the Load and Configure button to set the initial scope. Any missing parameters are automatically added as the empty value of that type.
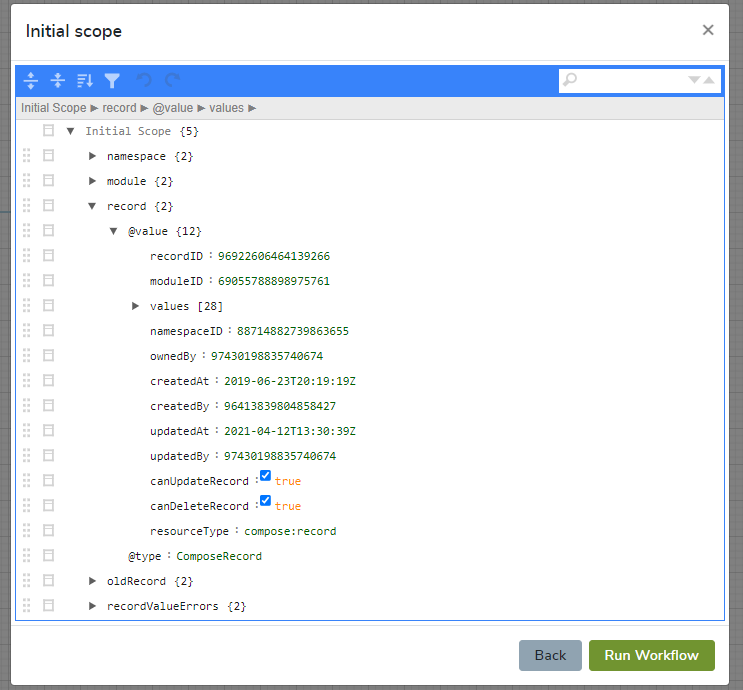
The last step allows you to change the variables of the initial scope before test running the workflow. Click on the Run Workflow to run the workflow, or on the btb:[Back] button to return to the previous screen.
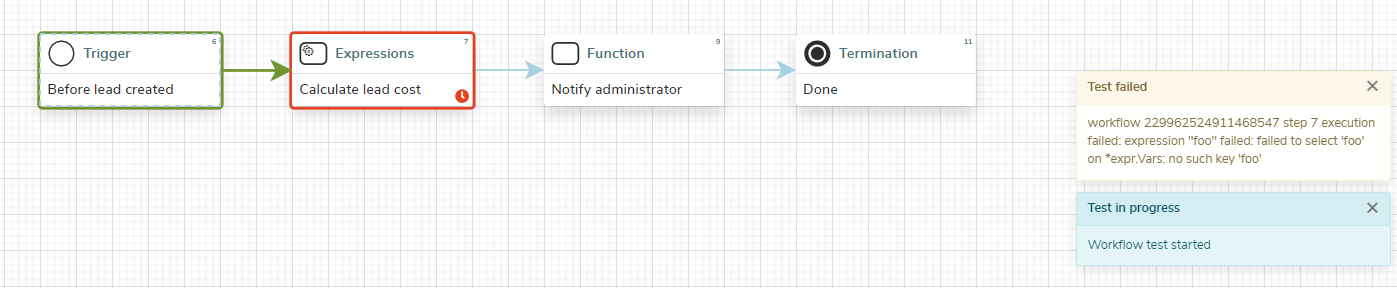
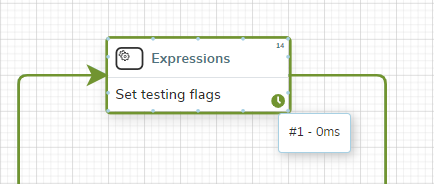
When a workflow is manually run, you see a green outline that indicates the execution path based on the provided input. If any of the steps fail to execute successfully, they are be marked with a red outline. If there is no error handling, the manual execution is also terminated.
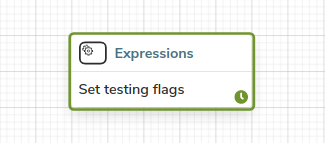
In some cases, your workflows may implement steps that should only run in production, such as client charging, mass email notifications, and similar.
We can mock this path of execution by defining a testing flag at the beginning.
Before you reach the "in production only" steps, you should use an exclusive gateway to carry out distinctive handling, such as logging a message or using a debug step  .
.
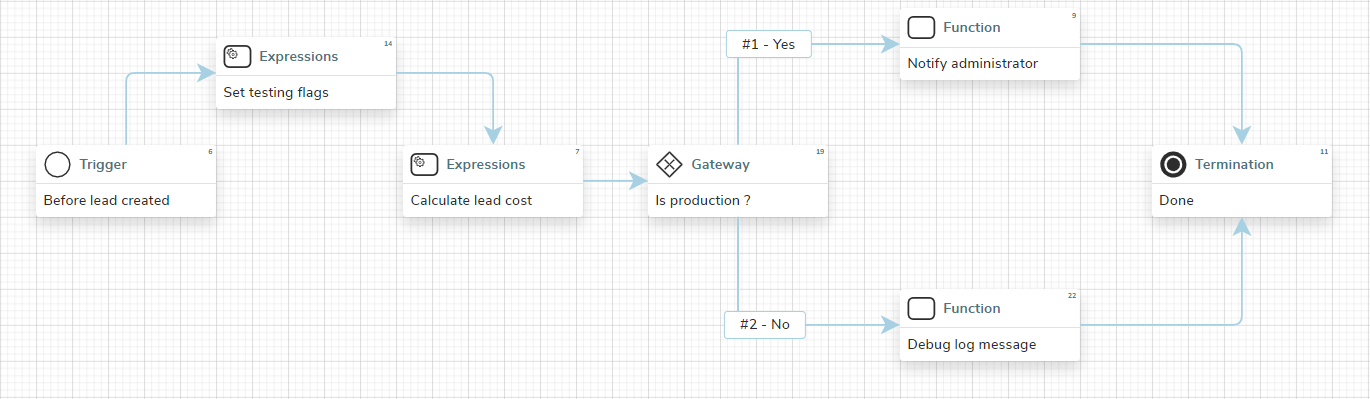
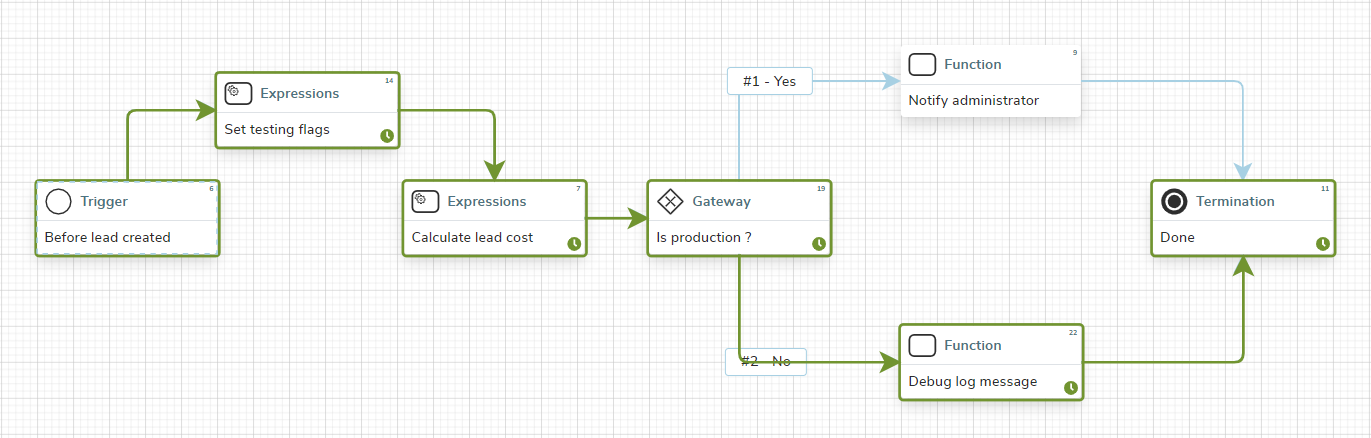
When you run the workflow after that step, you should see something like the below example:
Debugging
Knowing how to debug a specific tool or software can save you a lot of time if you encounter an issue.
The debugging step
The debugging step allows you to inspect the contents of the scope it resides in.
The debugging step uses the logger configured by the server and it is not visible in the workflow editor itself.
Test result context
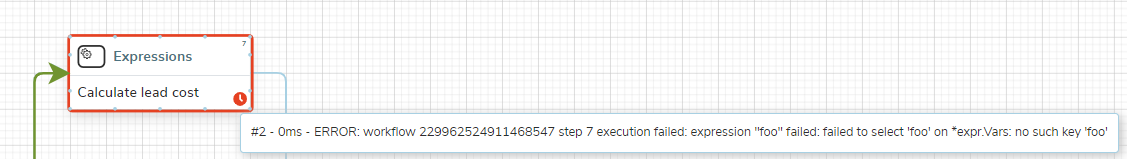
When you run a manual test for the workflow you might notice an icon in the bottom right corner of the step.
When you hover over the icon you see the important information regarding the steps' execution.
If you hover over a successful step (step with a green outline), you see the duration of the execution. Knowing the duration of the execution can help you pinpoint any system bottlenecks.
If you hover over a failed step (step with a red outline), you see the duration of the execution and the encountered error.